The full narrative — molecule, enzymes, routes, hepatic ER, VTE, and the prodrug attempt — rebuilt after fact‑checking, recalibrated against a working v4 PK model, and folded together with the deep dives.
What this is. An AI-generated synthesis of estradiol pharmacology — molecule, enzymes, route-dependent kinetics, hepatic ER-α effects, VTE risk, the EE outlier, and the prodrug strategy — written in May 2026 after a multi-stage fact-check of an earlier AI-generated synthesis (linked above). It has been primarily AI-fact-checked (two independent agents, Claude + GPT/codex, against primary literature) and re-anchored against a recalibrated PK model. It has not been clinically validated. Use for intuition, not medical decisions. Numerical predictions are good to ~2× for most things; inter-individual variability in real bodies is bigger than the model's error bars.
This is the integration of everything — the original story plus what the fact-check passes corrected and what the new quantitative model showed. The narrative is unchanged in its big arc: it follows estradiol from atoms (the C3 phenol and C17 hydroxyl) through enzymes, through hepatic concentration effects, through clinical outcomes, ending at the rational drug-design strategies the field has been attempting. The arc is the same. The numbers, in several specific places, are not. Where they changed, the change is called out explicitly — those are the load-bearing corrections.
Everything about estrogen pharmacology comes down to two atoms on a single molecule. Look at the 17β-estradiol skeleton:
17β-Estradiol with the two metabolically vulnerable hydroxyl groups highlighted. The C3-OH is a phenol (attached to the aromatic A ring), so it has very different reactivity from the C17-OH (an aliphatic secondary alcohol on the saturated D ring). The four fused rings (A and B and C are six-membered; D is five-membered) share edges at C5–C10, C8–C9, and C13–C14; the C18 angular methyl points up from C13. These differences in chemistry determine which enzymes can act on each position, which determines metabolism, which determines pharmacokinetics, which determines clinical effect.
The C3-OH is a phenol. Its pKa is ~10.7, so at physiological pH the molecule is essentially fully protonated and uncharged — passive diffusion across membranes works at every body site (gastric, intestinal, transdermal, sublingual). The aromatic A-ring is also what makes C3 vulnerable to conjugation: SULTs and UGTs grab the phenolic oxygen and attach a sulfate or glucuronic acid group, converting the hormone into a water-soluble inactive form that the receptor doesn't see.
The C17-OH is an aliphatic secondary alcohol on the saturated D-ring. Its chemistry is completely different: there's an α-hydrogen on C17 itself, which lets an oxidoreductase remove that hydrogen and convert the alcohol to a ketone — turning E2 into E1. This is the chemistry HSDs perform. C17 is also accessible to one UGT isoform (UGT2B7) for glucuronidation, but the dominant fate of C17 is redox, not conjugation.
Two atoms, two completely different stories. Understanding which enzymes can act on which atom is the foundation for everything else.
2The enzymes that act on those positions
Four enzyme families do almost all the work. Each one has a clear preferred position and a clear directionality.
HSD17B1: ovary, placenta, breast · HSD17B2: liver, gut, endometrium
SULTs
C3
Sulfation (→ inactive, hydrophilic)
SULT1E1 (lowest Km for estrogens of any human SULT — ~5–20 nM for E2)
Liver (high), intestine, endometrium, placenta
UGTs
Both
Glucuronidation (→ biliary excretion)
UGT1A1, 1A3, 1A8, 1A10 (C3); UGT2B7 (C17 of E2)
UGT1A10 in gut wall — ~10× more active on E2 than hepatic UGT1A1; others mostly liver
CYPs
C2, C4, C16α
Hydroxylation (→ catechol estrogens, E3)
CYP1A1, 1A2, 1B1, 3A4
Liver, lung, other tissues
STS
C3
Cleaves E1S → E1 (reactivation)
Single isoform
Breast, endometrium, brain, placenta, liver
The directionality of HSD17B1 vs HSD17B2 is the masterstroke. Same chemical reaction; different tissues; different cofactor pools:
Liver, gut, endometrium express HSD17B2 with NAD⁺ cofactor. Cytoplasmic [NAD⁺]/[NADH] in fed-state hepatocyte ~700 (Williamson 1967) — strongly drives E2 → E1 (deactivation). This is why a hepatocyte sits at ~5–10:1 E1:E2 at equilibrium, with the higher end of that range being a thermodynamic estimate the old AI built (sound arithmetic, fragile inputs — see §13) rather than a measured number.
Ovary, breast, target tissues express HSD17B1 with NADPH cofactor. Cytoplasmic [NADPH]/[NADP⁺] ~100 — drives the opposite direction: E1 → E2. Circulating E1 can be reactivated to E2 inside ER-target cells.
Estrogen activity isn't just plasma concentration — it's which tissue you're in. The same E1 in plasma can be reduced to E2 inside a breast cell while being oxidized back to E1 in a hepatocyte. The body uses tissue-specific enzyme expression to create directional gradients, and target tissues actively pull active hormone from the inactive reservoir.
The two-enzyme directional pump. SULT1E1 + STS form one such pump (sulfation/desulfation at C3). HSD17B2 + HSD17B1 form another (oxidation/reduction at C17). The liver "quietens" the hormone by both arms; target tissues "reawaken" it by both arms. Circulating E1-sulfate is the inactive currency that traffics between them — the most abundant circulating estrogen species in essentially every hormonal state (men, premenopausal women, postmenopausal women, people on HRT, pregnancy: E1S is always 3–15× the free E1+E2 pool).
3The oral path: where 1 mg actually goes
Take 1 mg of micronized oral estradiol. Within 24 hours the dose has been transformed into a specific distribution of metabolites. Central estimates synthesized from Kuhl 2005, Stanczyk 2013/2024, in vitro UGT1A10/UGT1A1 activity studies, the new v4 model fits, and clinical PK data:
Mass balance for 1 mg oral micronized E2. This is a v4-model-calibrated fate estimate, not a directly measured human radiolabel mass balance study. The buckets are constrained by plasma E2/E1/E1S anchors plus in-vitro UGT/SULT activity, not by a 24-h radiolabel measurement on dosed humans (which doesn't exist for E2 the way it does for some other drugs). Kuhl's textbook mass balance gives looser fractions (~15% E1, ~25% E1S, ~50% glucuronides); the model fractions here come out a bit different because they're calibrated to match plasma anchors, which dominate model fit. The single most important number is the qualitative one: only ~40 μg of the 1000 μg dose ends up as free E2 in systemic circulation. The rest has been transformed. About 300 μg arrives as E1, another 320 μg as E1S, and the E1S acts as a slow-release reservoir target tissues mine over the following 12–24 hours via STS reactivation. The "5% bioavailability" of oral E2 vastly understates its total estrogenic activity over time. What changed from the original: the F_oral_E1 fraction was bumped from 0.18 → 0.30 to match the observed oral E1/E2 ratio of ~5 in patients (Kuhl 2005). The numbers are now self-consistent across plasma anchors but treat exact dose-fate fractions as C3 (inferred from related sources) not measured.
The clinical numbers this produces are well-established:
Plasma total E2: 30–50 pg/mL at steady state on 1 mg/d (peak ~8 h post-dose)
Plasma total E1: 150–300 pg/mL — about 5–7× the E2 level
Plasma E1S: 2,000–4,000 pg/mL — about 50–100× the E2 level
Apparent half-life: 13–20 hours (vs the true half-life of free E2, which is only 1–2 hours when measured by IV bolus)
The apparent half-life is the non-obvious feature. The 13–20 h figure isn't how fast free E2 is metabolized — it's how fast the E1S reservoir releases free hormone back to plasma. Without the reservoir, oral E2 would need q2h dosing; with it, once daily is enough.
A note on the two stages of "first-pass". The ~40% gut-wall conjugation shown above and the "UGT1A10 is ~10× more active on E2 than hepatic UGT1A1" claim from §2 are the same fact stated two ways — the gut wall kills a big fraction of the dose because the enzyme there is so catalytically fast. But that alone wouldn't get oral bioavailability down to ~5%; it only gets it down to ~60%. The remaining ~580 μg of free E2 then hits the liver, where another ~90% of that is extracted on first pass (HSD17B2 oxidation, SULT1E1 sulfation, more glucuronidation, biliary export via MRP2). Gut and liver are two compounding filters, and "first-pass" properly means both. Only the product of the two losses gives the ~4% free-E2 bioavailability that ends up in systemic circulation.
What the "gut conjugates" actually are, and where they go
The 400 μg "conj" bucket in the mass balance is a mix of glucuronide and sulfate adducts, in roughly this composition for E2:
E2-3-glucuronide (the major species; ~60–75% of gut conjugates). UGT1A10 attaches glucuronic acid at the C3 phenol. UGT1A10 has higher activity on this position than any liver isoform.
E2-17-glucuronide (~20–30%). UGT2B7 attaches glucuronic acid at the C17 secondary alcohol. UGT2B7 is the only UGT that conjugates the C17 position of E2 with appreciable activity.
E2-3-sulfate (~5–10%). SULT1E1 dominates this contribution at physiological [E2] (Km ~5–20 nM) despite having lower gut abundance than SULT1A1 (Km ~2.4 μM for E2); the higher-affinity enzyme wins at low substrate concentrations. (An earlier draft said the reverse — that was wrong; mechanism fact-check round 2 caught it.)
These conjugates have three possible fates: (a) refluxed back into the gut lumen across the apical enterocyte membrane via MRP2, (b) exported into portal blood across the basolateral membrane via MRP3, or (c) processed by hepatic enzymes once they reach the liver. Conjugates that make it into the colon can be deconjugated by bacterial β-glucuronidase — regenerating free E2 that can then be reabsorbed. This is the enterohepatic recirculation loop, and it's part of why the apparent half-life of oral E2 is longer than the E1S reservoir alone would predict.
Direct primary data on E2 in human gut (and what's missing)
The gut-wall first-pass fraction for E2 is inferred rather than directly measured. The primary data:
Strassburg et al. 1998, 2000 — characterized UGT1A8 and UGT1A10 expression patterns in human intestinal microsomes; established that UGT1A10 is highly expressed in the gut wall (foundational work on intestinal UGT distribution).
Basu et al. 2004 (J Biol Chem, PMID 15117964) — the load-bearing reference for "UGT1A10 ~10× more active on E2 than hepatic UGT1A1." Measured E2-glucuronidation kinetics across recombinant human UGTs.
Cheng et al. 1999 — recombinant UGT1A regiospecificity for catechol estrogens; relevant for catechol-pathway minor metabolites rather than primary E2-3-G kinetics.
Lépine et al. 2004 (JCEM) — comprehensive UGT activity table covering all 19 human UGTs against E2, E1, and other steroids. The C3 vs C17 regioselectivity comes from this work.
Itäaho et al. 2008 (Drug Metab Dispos) — review and update of the above, with refined kinetic constants.
Pichard et al. 1990 — characterized CYP3A4 expression in human gut; relevant for catechol estrogen formation (though minor pathway for E2 first-pass).
Powers et al. 1985 — compared oral vs IV E2 PK in women, derived total first-pass extraction. Doesn't distinguish gut vs hepatic.
What's not in the literature: no human portal-vein cannulation study has been done on E2 the way Back & Rogers 1982 did for EE. So while the in vitro biochemistry on E2 in gut is well-characterized (and the basis for the 30–50% gut-conjugation estimate), there's no direct in vivo human measurement of the fraction of an oral E2 dose that's conjugated at the gut wall vs the liver. The number is built from the in vitro enzyme activities plus the observed oral/IV bioavailability ratio, not from a portal-vein measurement on humans dosed with E2.
What the three oral routes actually look like over time
Putting sublingual E2, oral E2, and oral EE on the same time-course makes the route-dependence visible. Single-dose curves, post-dose hour on the x-axis:
Single-dose time courses. These are model curves built from central-estimate parameters in Kuhl 2005 (oral E2), Doll 2022 + Cirrincione 2021 + the transfemscience.org sublingual E2 review (sublingual), and Goldzieher/Brody 1989 + Klipping 2012 (EE, single-dose). AUC(0–24) for the drawn curves: SL E2 ~660, oral E2 ~590, oral EE ~660 pg·h/mL. These AUCs are integrals of the drawn model curves, not published anchors — Doll 2022 only directly reports AUC(0–8) and a 1.8× SL/oral ratio. The most important shape feature, which I had wrong on the first pass: sublingual E2 is distinctly biphasic, while oral E2 is closer to monoexponential. The transfemscience review describes SL E2 as having "an elimination half-life of only a few hours" — meaning the directly-absorbed fraction crashes with free E2's own clearance kinetics (IV t½ 1–2 h). My curve now shows this: 1h→4h apparent t½ ≈ 1.7 h, much faster than oral E2's smooth decline. The slower reservoir-driven tail (~13 h apparent t½ — model inference, not directly measured) only takes over after the directly-absorbed fraction is gone, around 4–6 h post-dose. The reservoir is smaller for SL than oral, so the SL late tail sits below the oral E2 late tail. The EE curve was also previously wrong on the first pass: I'd drawn the Yasmin-label steady-state Cmax of ~95 pg/mL and labeled it single-dose. The plot now uses the actual single-dose Brody/Goldzieher data (next figure) scaled to 30 μg, giving Cmax ~70 pg/mL at 1 h with a characteristic 4–6 h enterohepatic-recirculation plateau before β-phase decay. The EE curve still visually overlaps SL E2 partly because of dose coincidence (1000 μg SL E2 vs 30 μg EE → per-μg, EE is ~12× higher concentration). Don't read this chart as "the three are biologically equivalent" — they are not. EE is plotted as EE concentration, not as E2-equivalent. At the peripheral ER, EE is only ~1.5× E2; at the hepatic ER (the relevant one for SHBG and clotting-factor induction), EE is tens- to hundreds-fold more potent depending on endpoint (Kuhl 2005's weight-basis table). So the EE curve at the same Cmax produces vastly more hepatic effect than the SL E2 curve.
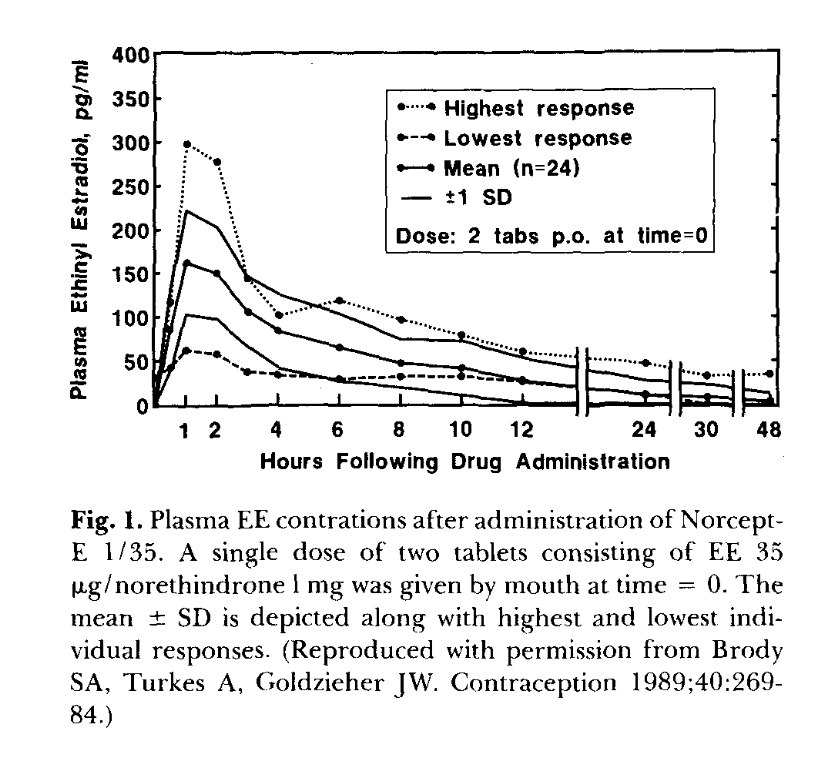
Primary-data anchor for the EE curve above. Reproduced from Goldzieher 1990 (Figure 1), originally Brody, Turkes & Goldzieher 1989, Contraception 40:269–84. Single-dose 2-tablet (= 70 μg EE) administration to n=24 women. Mean Cmax ~160 pg/mL at 1 h; note the highest-responder peak at ~300 pg/mL — 5× the lowest responder. The mean curve shows the characteristic 4–6 h enterohepatic-recirculation plateau, β-phase decay to ~35 pg/mL by 24 h, and ~10 pg/mL by 48 h. My synthetic curve in the previous figure is roughly Goldzieher mean × (30/70) — i.e., linear dose-scaling, which is approximately right for EE in this dose range (Stanczyk 2013; Goldzieher 1990). The huge highest/lowest-response spread (n=24, same drug, same dose) is the inter-individual variability the model curves do not show — real PK has 30–60% CV on most parameters, and you can see it directly here.
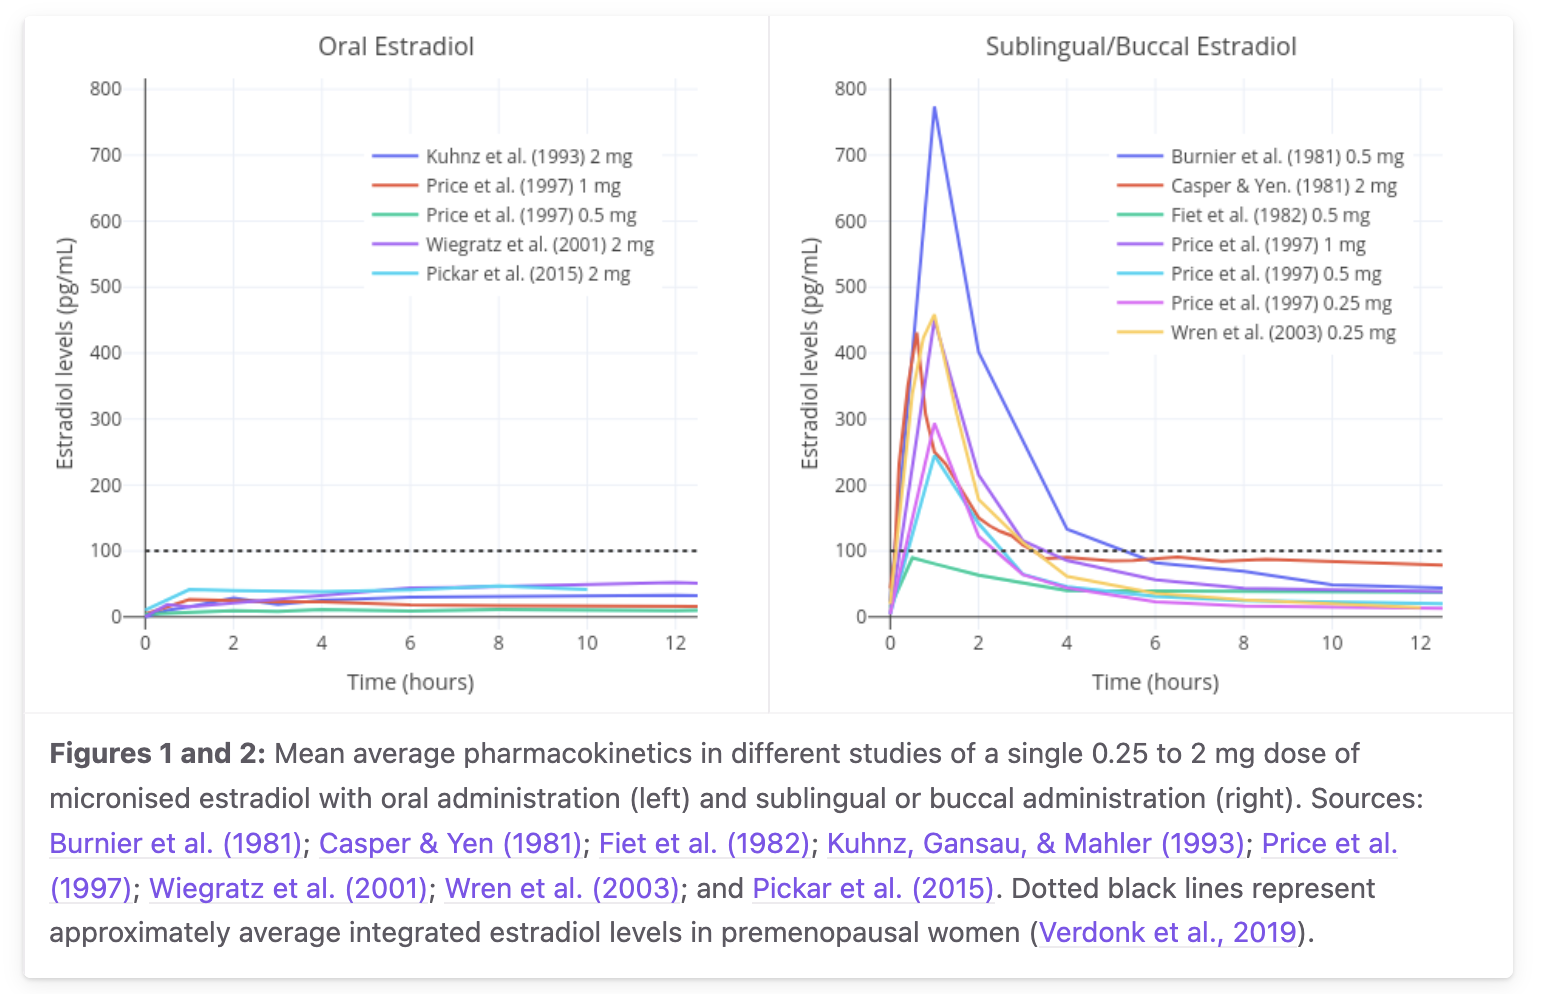
Primary-data anchor for the oral and sublingual E2 curves. From the transfemscience.org sublingual E2 review, aggregating mean curves from Burnier 1981, Casper & Yen 1981, Fiet 1982, Kuhnz 1993, Gausau & Mahler 1993, Price 1997, Wiegratz 2001, Wren 2003, Pickar 2015 — single dose 0.25 to 2 mg micronized estradiol. The dotted black line is the premenopausal-average integrated estradiol level (~50 pg/mL, Verdonk 2019). This is the chart that should drive your intuition, not my smooth schematic above. Two things stand out: (a) the curve shape difference is real and large — oral is broad and modest, sublingual is sharp and high; and (b) the inter-study Cmax variability for 1 mg sublingual spans roughly 100–400+ pg/mL, a factor of ~4. My single 140 pg/mL central curve corresponds to the lower end of this range (it follows Doll 2022's LC-MS/MS measurement); other studies, often older RIA-based, report substantially higher peaks. The "true" central value depends on assay method, individual variability, and how much of the tablet was actually retained sublingually rather than swallowed. My schematic curve preserves the route physiology (biphasic decay, lower late tail than oral) but does not honestly show the Cmax uncertainty — read both figures together.
Where the long tail comes from — and why oral takes longer to peak than sublingual
You asked: is the oral peak late because gut absorption is slow? No — gut absorption is fast for both routes (~30–60 min for oral E2 to cross the enterocyte). The reason oral peaks at 8 h while sublingual peaks at 1–2 h is about where the dose goes, not about how long it takes to be absorbed:
Sublingual — some uncertain fraction of the dose (older textbook estimates say ~20–25% direct; the v4 PK model elsewhere on this page uses ~5% direct calibrated against Doll 2022's AUC ratio; the only primary anchor is a marmoset study at 10%; human absolute direct sublingual bioavailability is not cleanly measured) absorbs across the sublingual mucosa straight into systemic circulation as free E2. That fraction reaches venous return → heart → systemic in roughly the time it takes a sip of liquid to dissolve. Plasma peaks at 1–2 h and decays fast (free-E2 t½ is only 1–2 h). The rest is swallowed and follows the oral path. Relative AUC of sublingual vs oral E2 at the same dose is ~1.8× (Doll 2022) up to ~2–5× (older studies).
Oral — the dose goes GI lumen → enterocyte → portal vein → liver. Gut wall conjugates ~40% of E2 to glucuronides via UGT1A10. Of what enters the liver, ~90% is extracted on first pass: HSD17B2 oxidizes most of it to E1, SULT1E1 sulfates E1 to E1S, UGTs glucuronidate. Only ~5% of the dose comes out the other side as free E2. The plasma E2 you see at 8 h is mostly not the directly-absorbed fraction (that already came and went). It's the back-conversion: E1S that target tissues (and the liver in reverse) cleave to E1 via STS, which is then reduced to E2 by HSD17B1.
This is what the apparent half-life is measuring. Free E2 itself has an IV-bolus half-life of only 1–2 h. The 13–20 h "oral apparent half-life" is the decay rate of the E1S reservoir, which is what's continuously back-feeding the free-E2 pool. Specifically:
E1S plasma half-life: 10–12 h (Ruder 1972). This is the rate-limiting step for clearance of the reservoir.
For a 1 mg oral dose, ~32% (≈320 μg-equivalent) enters the systemic compartment as E1S. That reservoir then bleeds back over 12–24 h via STS reactivation.
For a 1 mg sublingual dose, the E1S reservoir is smaller (because only the ~75% swallowed fraction goes through hepatic first-pass; the ~25% directly-absorbed fraction skips it). The sublingual long tail therefore has lower steady-state plasma E2 than oral.
So the apparent half-life difference between oral and sublingual isn't really about absorption rate. It's about how much E1S each route loads into the reservoir per dose. More E1S → flatter, longer-tailed plasma E2 curve. The E1S kinetics (10–12 h half-life, STS reactivation in target tissues) are the same in both cases; only the reservoir size differs.
Practical consequence for dosing. Sublingual gives a sharper peak/trough cycle than oral at the same dose because it builds a smaller E1S reservoir. Splitting sublingual into 2–3 doses per day flattens this (and is the standard recommendation). Oral E2 (and E2-valerate, which behaves identically) is more forgiving on once-daily dosing because the larger E1S reservoir naturally smooths the curve. Estradiol-valerate is roughly interchangeable with oral E2 from minute 30 onward — the C17 valerate ester is hydrolyzed by gut and plasma esterases that fast. The choice between them is regional (US uses oral E2 mostly; UK / Germany / continental Europe historically use Progynova / EV).
4All the routes side‑by‑side
Route determines two distinct quantities: (1) how much drug reaches systemic circulation, and (2) how much of it the liver sees during first-pass. These can diverge dramatically.
Oral E2 valerate behaves essentially as oral E2. The valerate ester at C17 is hydrolyzed by esterases in the gut wall and plasma within 30 min, regenerating free E2 plus valeric acid. From that point on, pharmacokinetics are identical to oral E2 with one molecular-weight correction (E2V is ~76% E2 by mass; 1.5 mg E2V ≈ 1.15 mg E2).
The E1:E2 ratio is a route signature. Premenopausal cycling women have a ratio near 1:1 (the ovary makes both, with some peripheral conversion). Transdermal and injectable routes produce ~1:1 because they deliver E2 systemically without portal-vein concentration. Oral routes produce 5:1 or higher because hepatic HSD17B2 runs the NAD⁺-driven equilibrium during first-pass. The E1:E2 ratio is a direct readout of how much hepatic exposure the hormone has had.
Sublingual is the awkward middle. The peak is 4× oral, the ratio is closer to physiologic at peak, and it bypasses the first-pass bolus. So it looks like a clean compromise. The actual evidence (§7) tells a different story.
5Hepatic ER‑α: receptor, threshold, and where the old framing oversimplified
The mechanism connecting all of this to clinical outcomes is hepatic ER-α — the estrogen receptor expressed in hepatocytes. When activated, it transcriptionally upregulates dozens of liver-synthesized proteins, including the coagulation cascade.
The single most important correction. The original synthesis quoted a hepatic ER-α Kd of 0.25 nM for E2 (~68 pg/mL free) — that number is in the Yager & Williams 1989 Cancer Research paper — and then built a Hill saturation curve on top of it, concluding that "routes that keep plasma E2 below ~68 pg/mL avoid hepatic effects" was the unifying rule. Both fact-checkers flagged this as too crisp. The receptor Kd is sub-nM, but the empirical dose-response for SHBG mRNA induction in HepG2 cells (Mercier-Bodard 1999 and others) shows responses at 250 nM–2.5 μM E2 — far higher than the receptor's nominal Kd. The reason: SHBG induction requires sustained transcriptional activity, not just transient receptor binding. So the rule isn't "above Kd → hepatic effect" but "above the integrated-exposure threshold for SHBG mRNA induction → hepatic effect," which is a much fuzzier line. (Earlier drafts of this page cited Selva & Hammond 2009 for the ~1500 pg/mL EC50 figure used in the v4 model — but that paper is on HNF-4α / thyroid-hormone regulation of SHBG, not estradiol dose-response. The 1500 pg/mL is a v4 calibration target, not a measured value; the round-2 mechanism fact-check caught this. Removed in this draft.)
The Kd is fine for plotting where the receptor is mostly bound. It's not the right parameter for predicting which routes elevate clotting factors. The right framing is:
Receptor occupancy tracks free hepatic E2 with a steep curve centered around ~68 pg/mL (Kd).
SHBG induction tracks free hepatic E2 with a much shallower, higher-threshold curve centered around ~1500 pg/mL (calibrated EC50 in the v4 model) and a slow time constant (τ ≈ 3 days from SHBG protein turnover).
Coagulation factor induction probably tracks something in between, with protein-specific sensitivity. Protein S is unusually peak-responsive (Bar 2024) — different shape from SHBG.
The qualitative claim — that route, not dose, is what governs hepatic effects — is still right. The quantitative framing in the original (single Kd, single Hill curve, threshold at 68 pg/mL) was too crisp.
Two different Hill curves drive two different things. ER-α occupancy (coral) saturates around the receptor Kd of ~68 pg/mL — but receptor occupancy isn't the endpoint that drives clinical effects. SHBG mRNA induction (blue) follows a separate, much higher-threshold curve with EC50 around 1500 pg/mL of free hepatic E2. Transdermal and cycling baseline stay below both curves. Pregnancy (red, dual marker) saturates the receptor (~82% occupancy at 300 pg/mL) but only moderately activates SHBG induction (~17%) — which is why pregnancy SHBG isn't fully explained by E2 alone (HCG-driven contributions matter). Oral E2 during first-pass (coral, dual marker) pushes hepatic concentration to ~5000 pg/mL during absorption, near-fully saturating ER-α occupancy and driving the SHBG curve to ~77% of modeled maximum (Hill n=1, EC50 = 1500 pg/mL → 5000/(5000+1500) ≈ 0.77) — which is the mechanism behind oral HRT's hepatic effects despite modest systemic E2.
Protein S; antithrombin; IGF-1; GH-driven proteins
Loss of anticoagulant capacity
↔ Resistance to APC
via factor V Leiden-like state
Acquired thrombophilia
The net hemostatic shift is procoagulant. Importantly, this is a local effect of the hepatocyte — plasma protein levels track the concentrations the hepatocyte sees, which depends on route, not on systemic E2.
6Why VTE risk doesn't scale with plasma E2
If hepatic protein induction is the mechanism, why doesn't the procoagulant effect scale linearly with plasma E2? Pregnancy gives the cleanest natural experiment: term plasma E2 is ~250× cycling baseline, yet pregnancy VTE risk is only ~3–10× baseline, not 250×. Several mechanisms compound to attenuate the signal:
The cascade from plasma E2 to thrombosis is real qualitatively but the specific multiplicative factors shown are model heuristics, not stepwise sourced constants. Round-2 fact-check corrections: the original draft had "÷3 SHBG buffering" — actual pregnancy SHBG rise drops the free fraction only to ~60% of nonpregnant, so free E2 attenuation is closer to ÷1.7 than ÷3. The "÷2 TFPI ↑ + endothelial NO ↑" step was also wrong-direction: in pregnancy, TFPI and free protein S actually decrease, which is procoagulant, not compensatory — there is no net anticoagulant buffer at this stage. And the "×3 Virchow's triad" multiplier was invented to make the numbers land at the empirical 3–10× pregnancy VTE; the qualitative point (Virchow factors matter on top of the hormonal substrate) is right but the multiplier isn't sourced. The diagram is kept as a teaching device for the structure of the attenuation chain — total E2 ≠ free E2 ≠ hepatic effect ≠ net coagulation ≠ VTE — but each arrow's factor should be read as illustrative. Route matters more than dose is the load-bearing qualitative claim and is fully supported.
The clinical VTE numbers — and the load-bearing fact-check correction here:
ESTHER's oral E2 OR is 4.2, not 2. The original synthesis quoted "oral HRT ~2× baseline" — that's pooled meta-analysis territory (Scarabin 2015 ≈1.48; Vinogradova 2019 ≈1.7). The ESTHER study itself (Canonico 2007, Circulation, PMID 17309934) reports an adjusted OR of 4.2 for current oral estrogen users and 0.9 for transdermal users. Both fact-checkers flagged this. The pooled estimates dilute the ESTHER signal; the 4.2 vs 0.9 contrast is the actually striking number, and it's the one the population-level recommendations against oral HRT are built on.
Therapy
VTE relative risk
Source / mechanism
Healthy non-pregnant baseline
1.0×
—
Transdermal E2 HRT
0.9–1.0×
ESTHER (Canonico 2007): adjusted OR 0.9; hepatic E2 below EC50
Oral E2 HRT (1–2 mg)
~4.2×
ESTHER (Canonico 2007); SHBG curve saturated during first-pass
Oral E2 HRT (pooled meta-analyses)
~1.5–1.8×
Mohammed/Scarabin 2015; Vinogradova 2019 — dilutes the ESTHER signal
Oral CEE (conjugated equine estrogens)
~3–4×
Same mechanism + equilin sulfate effects
EE-based COCs (30 μg)
~3–4×
EE recirculates; max hepatic effect even at low doses
Pregnancy is the cleanest demonstration that hepatic exposure ≈ route, not dose. Pregnancy plasma E2 is 250× cycling baseline, but pregnancy hepatic E2 isn't 250× cycling baseline — because pregnancy E2 comes from the placenta into systemic circulation rather than via the portal vein. The liver in pregnancy sees roughly the same elevated systemic levels as the rest of the body, and the hepatic protein induction is heavy but saturated. Oral HRT at 1 mg/day produces ~50 pg/mL plasma E2 but ~5000 pg/mL hepatic E2 during first-pass — so it produces hepatic effects comparable to pregnancy despite having 1/500 the systemic level. Route determines whether the liver sits in saturation.
7Sublingual: where the model breaks
I want to flag what the original synthesis got wrong, because correcting it sharpens the whole story. The intuitive model was: "sublingual bypasses portal vein, so it bypasses first-pass, so it avoids hepatic effects." That's right for the first step (the PK is genuinely different) but the conclusion (no hepatic effects) doesn't follow. The data:
Cirrincione 2021 (LGBT Health 8:125): sublingual E2 produces plasma E1 levels much closer to oral than to transdermal/injectable. If sublingual were really liver-sparing, E1 would be at transdermal levels. It isn't — meaning sublingual E2 reaches the hepatocyte and gets oxidized there.
Pines 1999 and Lim 2019: sublingual produces hepatic protein synthesis changes (SHBG, lipids) similar in magnitude to oral, not similar to transdermal.
Bar 2024 (ECE conference, abstract EP592): sublingual E2 produces a clinically significant decrease in free protein S — the same pro-thrombotic shift oral E2 produces. The kinetics suggest protein S responds to peak exposure rather than AUC, which would mean sublingual is at least as bad as oral per unit dose, possibly worse.
Why does the intuitive model fail? Because the liver doesn't only see drugs on first-pass. It sees them on every blood circuit. Cardiac output ~5 L/min, hepatic blood flow ~1.5 L/min — the liver sees the entire systemic blood volume every ~4 minutes. For a drug with high hepatic extraction (E2 has ~70% extraction per pass), most of any systemically delivered drug ends up in the liver over a few hours; it just arrives in many small servings instead of one big one. Sublingual peaks lower than oral on each pass but the hepatocyte sees moderately elevated E2 every blood circuit, accumulating substantial integrated exposure.
And critically: hepatic ER responds to integrated exposure for SHBG-like (slow-induction) effects, but possibly to peaks for protein S. So sublingual could be worse than oral on protein-S-driven thrombosis even at lower AUC. Bar 2024 is suggestive of exactly this.
The v4 model captures sublingual as ~5% direct sublingual absorption (Doll 2022 AUC) + ~75% swallowed → normal oral first-pass. That gives an "intermediate" hepatic load — between oral and transdermal, but much closer to oral. The model's sublingual prediction is the only validation scenario sitting outside 2× (×2.18 on E1S), and the literature anchor there is itself uncertain.
The honest synthesis on sublingual. Only routes that keep both plasma E2 below the SHBG induction EC50 and peak free E2 below the protein-S sensitivity threshold genuinely avoid hepatic effects. That's transdermal, IM ester depots, and SC depots at typical doses. Oral and sublingual both produce hepatic protein-synthesis changes; the differences between them are smaller than first-pass theory suggests; sublingual may be worse per unit hormone exposure because of its higher peak concentrations. The original synthesis's claim of "20× hepatic exposure advantage for sublingual" was unsupported and has been retracted in the sublingual correction artifact.
8Ethinyl estradiol: the structural outlier (and three SHBG pathways)
Everything above describes E2 and E2-equivalent prodrugs. Ethinyl estradiol breaks the pattern.
EE is E2 with a 17α-ethinyl group (–C≡CH attached to C17). This single substitution changes everything:
HSD17B2 can't oxidize EE. Oxidation of E2 to E1 requires HSD17B2 to abstract the C17 carbinol hydrogen (the H attached to the same carbon as the 17β-OH). In EE that carbon is quaternary — bearing the 17β-OH, the 17α-ethinyl, and the two ring carbons C16/C13 — with no hydrogen available to abstract. So HSD17B2 cannot make an "E1-equivalent" from EE. The C17-OH is still there (it's a 17β-OH); the oxidation pathway is what's gone.
EE persists as EE. Without HSD17B2 oxidation, EE is cleared only by sulfation, glucuronidation, and CYP hydroxylation — all slower than the HSD17B2 arm for E2. EE half-life is 18–24 h at steady state vs 13–20 h for oral E2.
The gut wall does ~44% of EE's first-pass. Back & Rogers 1982 cannulated the portal vein in humans and measured first-pass extraction of EE directly: ~0.44 of the absorbed dose is conjugated in the enterocyte before reaching the portal blood. (This is the load-bearing primary measurement for the "gut-wall first-pass is large" claim — it was made on EE specifically, and shouldn't be uncritically transferred to E2.)
EE recirculates extensively. Its conjugates (EE-3-sulfate) are reversible via STS; the drug recirculates many times before being permanently cleared. Enterohepatic recirculation is real in humans (large in rats, modest in humans, but not zero).
Per-mole hepatic SHBG induction is large but endpoint-specific. Kuhl 2005 reports oral EE vs oral E2 on a weight basis, and the apparent disproportion depends on which hepatic protein you measure: ~100× for SHBG, larger for some other hepatic proteins, smaller for others. The "~100×" used as shorthand throughout this page is a modeling shorthand averaged over hepatic-protein endpoints, not a universal measured constant. At the peripheral ER, EE is only ~1.5× as potent as E2 per mole — the disproportion is hepatic, not general.
EE does not bind SHBG meaningfully. Kd for SHBG is ~50× weaker than E2 (Kuhl 2005). So when EE drives SHBG up via hepatic ER, the rising SHBG does not trap the EE — but it crashes the free fraction of endogenous E2. This is why EE in COCs maintains biological activity while suppressing ovarian E2 to near-castrate levels.
The mass balance for an oral EE dose looks dramatically different from the oral E2 mass balance in §3 — both quantitatively (much higher F) and structurally (no E1 equivalent, smaller sulfate reservoir):
Mass balance for a 30 μg oral EE dose. Total bioavailability (~45% free EE) and gut-wall extraction (~44%, Back & Rogers 1982) are the load-bearing measured numbers; the detailed split among the four "non-free-EE" buckets is a model allocation, not a primary mass-balance measurement. The single biggest visual difference from the E2 mass balance in §3 is the size of the "free drug" bucket: EE delivers ~45% of the dose to systemic circulation as parent EE, vs only ~4% for E2. The reason is structural — the 17α-ethinyl group blocks HSD17B2 by removing the C17 carbinol hydrogen, so the dominant E2-inactivation pathway (free E2 → E1 → E1S in the liver) is gone for EE. Hepatic first-pass therefore drops from ~90% extraction (E2) to ~25% (EE). The gut wall, by contrast, still does heavy work: Back & Rogers' direct portal-vein measurement put gut-wall conjugation at 0.44 of the absorbed dose. Back's later review (1990) emphasizes that the gut-wall product is principally sulfate (likely SULT1E1, which has higher catalytic activity on EE at physiological concentrations than SULT1A1 despite lower gut abundance) — not predominantly glucuronide as you'd assume by analogy to E2. The other striking difference from E2 is the lack of an "E1-equivalent" bucket — EE never gets oxidized to a ketone form, so it has no E1-analogue and a much smaller sulfate reservoir than E2 does. This is also why EE is dosed in micrograms, not milligrams.
And here's where the new SHBG model adds insight. The v4 model splits SHBG induction into three parallel pathways, each calibrated against a different scenario:
The three pathways add additively (capped at full saturation). The EE pathway is the most potent per-dose because EE's first-pass hepatic concentration during absorption is enormous and the drug persists once inside the hepatocyte.
The empirical SHBG-rise table on combined OCs makes the point quantitatively (Stegeman 2013, Kuhl 2005):
Formulation
SHBG rise from baseline
EE 20 μg + LNG 100 μg (Alesse)
+80 to +150%
EE 30 μg + LNG 150 μg (Microgynon)
+100 to +150%
EE 30 μg + desogestrel 150 μg
+200%
EE 30 μg + drospirenone 3 mg (Yasmin)
+200 to +300%
EE 30 μg + dienogest 2 mg
+320%
EE 35 μg + cyproterone 2 mg (Diane-35)
+400%
EE >50 μg (older COCs)
+500 to +1000% (5–10×)
The progestin matters — androgenic progestins (LNG) blunt SHBG rise; antiandrogenic ones (drospirenone, cyproterone) amplify it. Diane-35 (EE + cyproterone) lands at roughly pregnancy-level SHBG. The estrogen choice (EE vs E2-valerate) matters at least as much.
VTE risk per-10,000-woman-years (Stegeman 2013, ASH 2024): no exposure ~1–5 · oral E2 HRT ~9–15 · transdermal E2 ~5 · EE + LNG ~5–7 · EE + drospirenone ~10–12 · E2V + dienogest (Qlaira) ~4–6 · old high-dose EE COCs ~15–20. The progestin matters, but the estrogen choice (EE vs E2-valerate) is at least as important.
Why EE is out of favor for trans HRT. EE roughly doubles VTE risk vs oral E2 at equivalent uterotrophic doses, with no offsetting benefit (the peripheral receptor sees EE and E2 as nearly equipotent). The Amsterdam cohort (van Kesteren 1997) drove the high VTE rates in older EE-based trans regimens. WPATH SOC8 and the Endocrine Society 2017 guidelines explicitly recommend against EE in trans HRT — use 17β-E2 (oral or transdermal or injectable) instead.
9What the fact-checks moved
The original synthesis was built on top of a 700-page conversation that drifted in several specific places. Two independent fact-checking agents (a Claude run and a GPT/codex run, via the codex CLI in a separate tmux session) plus a structured literature scan converged on the same major issues. Where they agreed, I've folded the correction into the narrative above. The mechanically load-bearing ones:
SHBG–E2 binding Kd
1 nM → ~20 nM · The 1 nM value is the SHBG Kd for DHT; for estradiol it's 10–30 nM (Hammond; Avvakumov 2010, PMC8144348). Propagates: free-fraction calculations get the wrong shape; SHBG buffering is overstated.
ESTHER oral E2 VTE OR
~2× → 4.2× (and transdermal 0.9×) · Canonico 2007 Circulation, PMID 17309934. The ~2× figure comes from pooled meta-analyses that dilute the ESTHER signal.
"Lindberg 2003" SHBG paper
Lindberg 2003 → Lindberg et al. 2005, JCEM 90:3431 · or Ropponen et al. 2005 for the related SHBG-rise reference. The +67–171% SHBG-on-oral-E2 numbers are right; the year was misremembered.
Postmenopausal endogenous E1 production
~80 μg/day → ~40 μg/day · Wikipedia E1S production table (Longcope 1986 / Grodin 1973). The 80 μg/day figure was likely premenopausal early-luteal data misapplied to postmenopause.
Pregnancy third-trimester E1S
~50,000 pg/mL → ~100,000 pg/mL (105 ± 22 ng/mL) · Wikipedia pregnancy-trimester table. The original anchor was about 2× low.
"Free E2 = 50 pg/mL in cycling women"
free E2 = 50 pg/mL → total serum E2 = 50 pg/mL; free is ~1 pg/mL · The original consistently labeled cycling-phase anchors as "free E2" when they meant total. Free fraction is ~2%.
Sublingual Tmax
~30 min → 1–2 hours · Doll 2022 LC-MS/MS (Endocr Pract 28:237). The 30-min figure may be from older RIA studies over-reading very low E2, or from first detectable rise rather than peak.
"5% bioavailability" of oral E2
F = 5% → F = 5% for free-E2 plasma AUC; ~30% for total estrogen; effectively >100% for hepatic exposure · The 5% is right, but the original used it without specifying compartment. The hepatic effect of 1 mg PO is comparable to ~100 μg/d transdermal because the liver sees portal concentrations, not systemic.
Hepatic ER-α Kd → SHBG induction chain
"Kd = 0.25 nM → SHBG Hill curve" → Kd is real (Yager 1989, rat hepatocyte). Hill curve isn't published — it was modeled. Empirical SHBG dose-response in HepG2 (Mercier-Bodard 1999 and others) is at 250 nM–2.5 μM, orders of magnitude higher than the receptor Kd. The v4 model uses 1500 pg/mL as a calibration target, not a measured EC50. · The receptor binds at the low Kd; SHBG transcriptional induction requires sustained activation, so the effective threshold is much higher. The "above Kd → hepatic effect" framing was too crisp.
Cytoplasmic [E1]/[E2] = 11
11:1 (arithmetic from NAD⁺/NADH × Keq) → "~5–20-fold E1 predominance, roughly consistent with observed plasma E1/E2 ≈ 5 in oral patients" · The arithmetic is correct conditional on inputs, but both inputs (NAD⁺/NADH ratio = 700; E°' for E1/E2 = −0.265 V) are shaky. The empirical observed ratio is the right anchor; the thermodynamic derivation is qualitative support.
What the original got right. Both fact-checkers confirmed the big-picture pharmacology: HSD17B2 oxidative liver, HSD17B1 reductive ovary/placenta; SULT1E1 has the lowest Km of any human SULT; UGT regioselectivity (1A1/1A3/1A8/1A10 for C3, UGT2B7 for C17); STS reactivates in target tissues; oral F ~5% / EE F ~45%; free E2 fraction ~2%; E1S is the dominant circulating estrogen species; pregnancy VTE gradient (~3× antepartum, ~9× third trimester, ~20–35× postpartum); transdermal HRT VTE ≈ baseline; oral HRT elevated; the EC508/E2MATE/sulfamate-CA II prodrug narrative; the conceptual SULT1E1 ↔ STS tissue-switching cycle. The conceptual scaffold survives. The numbers got crisper.
10The v4 quantitative model
The new model is a 5-state (E2, E1, E1S, EE, SHBG) ODE system integrated with scipy LSODA, with 12 calibrated scenarios. It replaces the original AI's JavaScript Euler integrator (which the original conversation admitted was hand-iterated and not actually run). The validation grid below shows model predictions vs literature anchors:
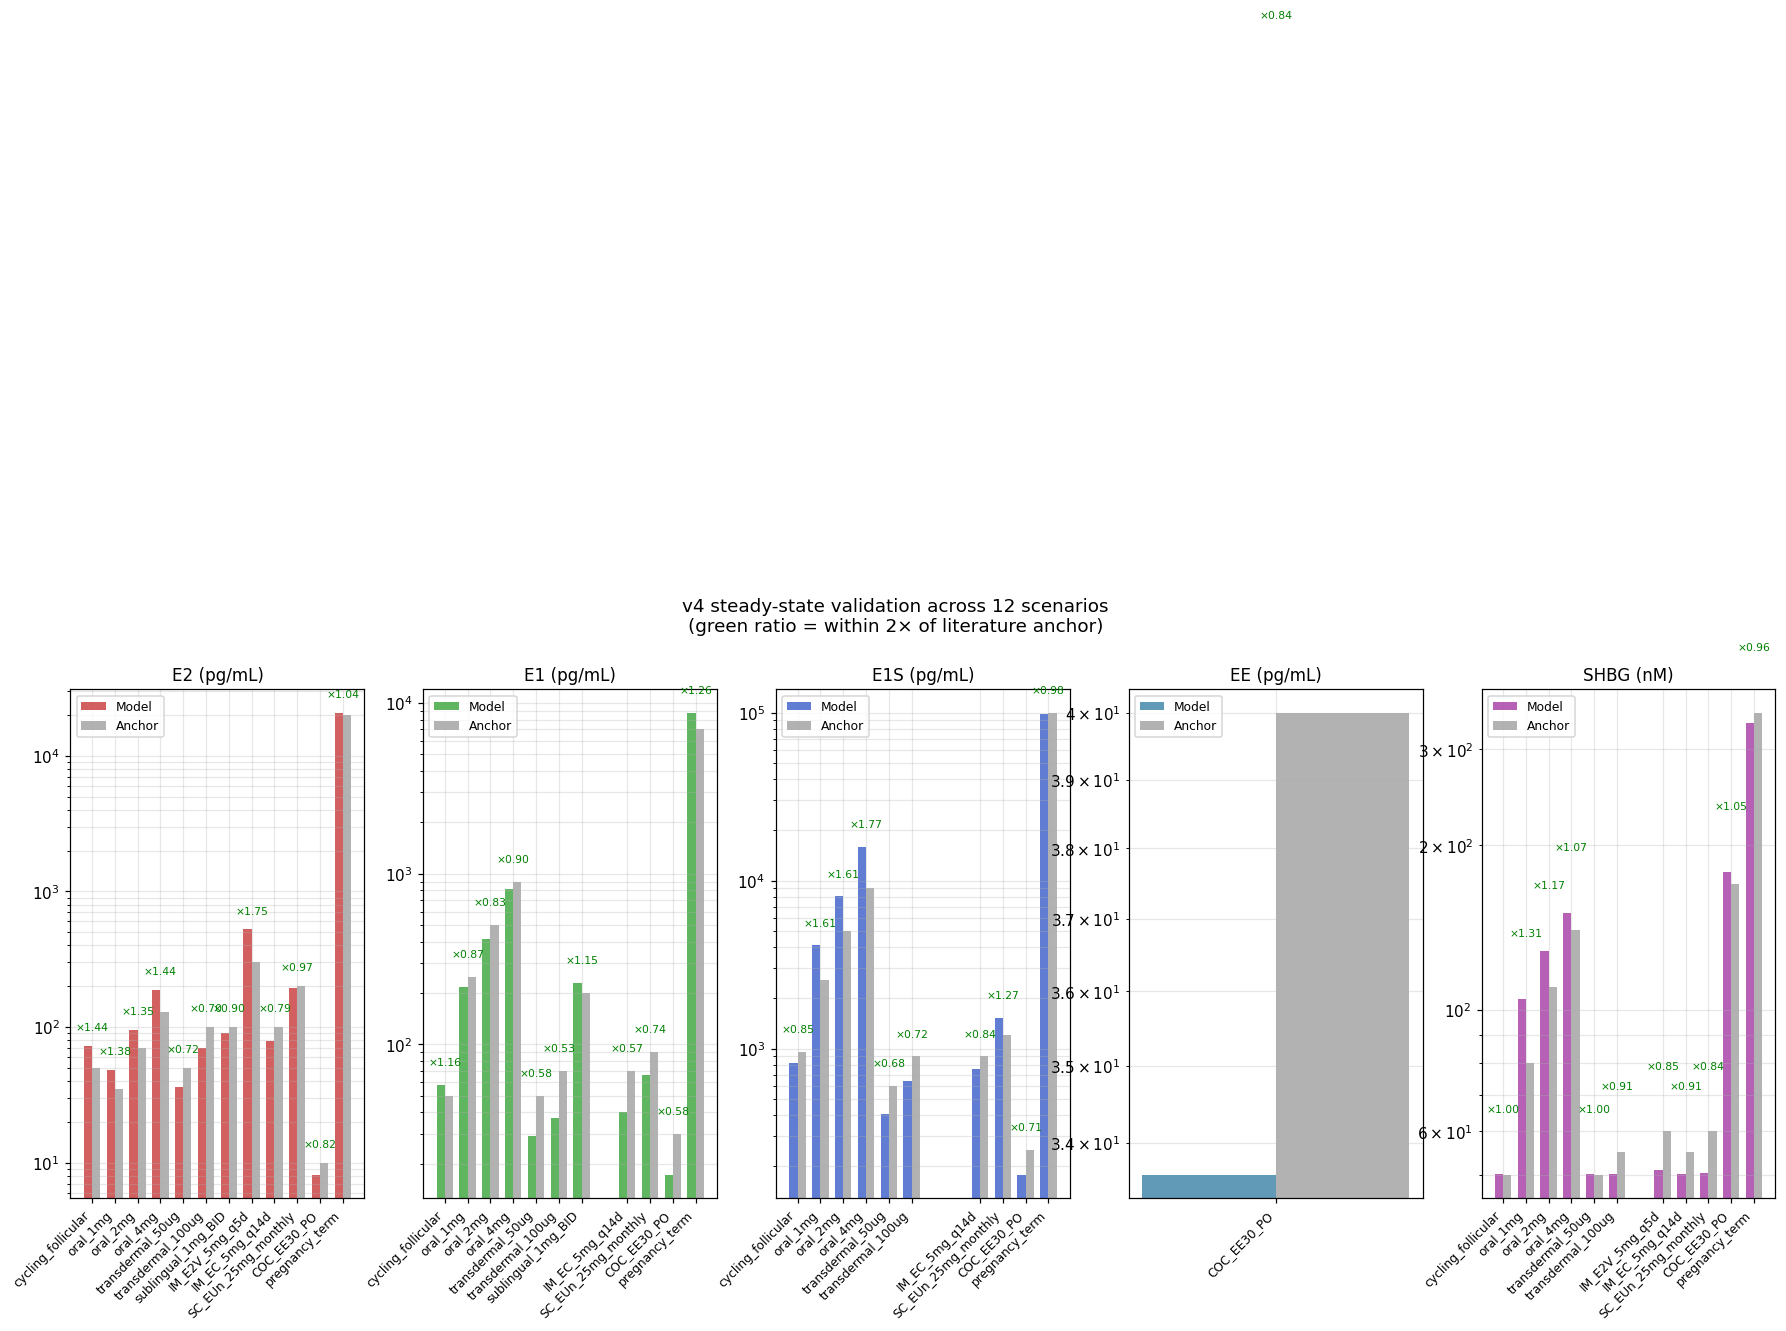
Validation across 12 scenarios. Model output (colored bars) vs literature anchors (gray bars) for E2 / E1 / E1S / EE / SHBG. 10 of 12 scenarios within 2× on all targets. The two outliers: sublingual E1S (×2.18, against a literature anchor that's itself uncertain) and pregnancy SHBG (×0.60, because the model lacks an explicit placental SHBG production term). Generated by v4_with_EE.py → plot_v4.py.
Scenario
E2 (m/a)
E1 (m/a)
E1S (m/a)
EE (m/a)
SHBG (m/a)
Cycling follicular
72/50 ×1.4
58/50 ×1.2
819/960 ×0.85
—
50/50 ×1.00
Oral 1 mg
48/35 ×1.4
218/250 ×0.87
4096/2560 ×1.6
—
105/80 ×1.31
Oral 2 mg
94/70 ×1.3
414/500 ×0.83
8013/5000 ×1.6
—
129/110 ×1.17
Oral 4 mg
186/130 ×1.4
807/900 ×0.90
15825/9000 ×1.76
—
150/140 ×1.07
Transdermal 50 μg
36/50 ×0.72
29/50 ×0.58
409/600 ×0.68
—
50/50 ×1.00
Transdermal 100 μg
70/100 ×0.70
37/70 ×0.53
644/900 ×0.72
—
50/55 ×0.91
Sublingual 1 mg BID
139/100 ×1.4
333/200 ×1.66
6537/3000 ×2.18
—
106/80 ×1.32
IM E2V 5 mg q5d
393/200 ×1.97
113/200 ×0.56
2841/1500 ×1.89
—
51/60 ×0.85
IM EC 5 mg q14d
79/100 ×0.79
40/70 ×0.57
758/900 ×0.84
—
50/55 ×0.91
SC EUn 25 mg monthly
193/200 ×0.97
66/90 ×0.74
1519/1200 ×1.27
—
50/60 ×0.84
COC EE 30 μg/d
8.2/10 ×0.82
17/30 ×0.58
178/250 ×0.71
34/40 ×0.84
179/170 ×1.05
Pregnancy term
20672/20000 ×1.03
8133/7000 ×1.16
53658/100000 ×0.54
—
211/350 ×0.60
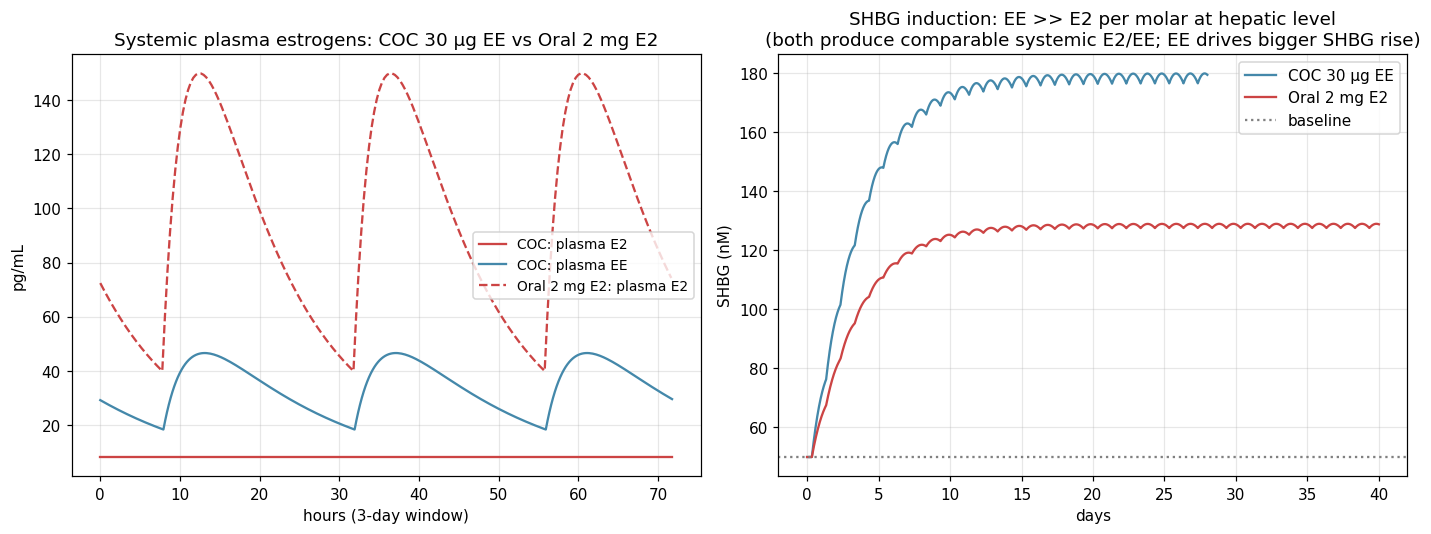
EE vs oral E2: same plasma estrogen, very different SHBG
A 30 μg/d EE dose gives plasma estrogen (EE) similar to what oral 2 mg E2 gives, but SHBG rises ~50% more than with oral E2. Per molar at the hepatic level, EE is ~100× more potent than E2 at SHBG induction. The mechanism is the 17α-ethinyl group blocking the HSD17B2 inactivation step that "uses up" oral E2 on first pass. This is the visualization of the central pharmacology lesson: EE is not 100× more estrogenic; it is 100× more hepatically estrogenic per mole.
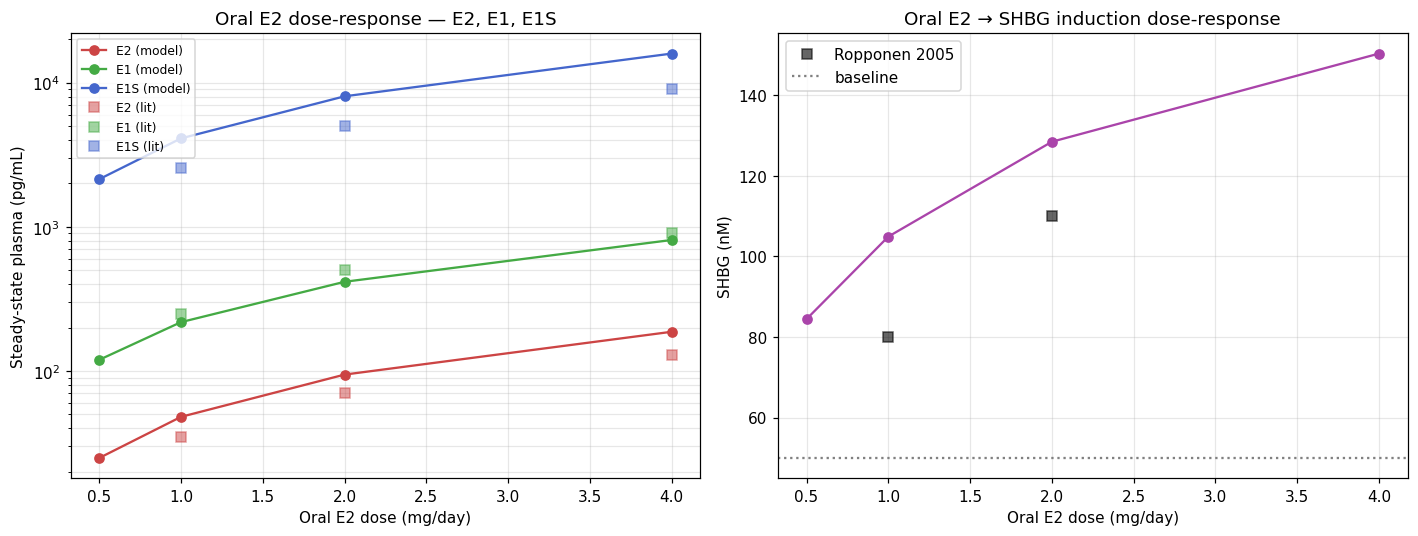
Oral dose-response
Model predictions vs Kuhl 2005 / Lindberg 2005 anchors. E2/E1/E1S linear across the 1–4 mg range (the SULT1E1 substrate-inhibition term starts to bite at the upper end, which is why E1S barely keeps pace at 4 mg). SHBG response is sub-linear (Hill saturation through pathway 2 of the three-pathway induction model).
How to actually run the model and play with it
Interactive viewer — pick a scenario, scrub through time, watch concentrations and metabolic fluxes update live. Green/red live ratio-vs-anchor coding. Self-contained HTML; no server needed.
Sankey flux diagrams — open any sankey_*.html in ./model/figures/v4/. Steady-state mass flow (μg/day) from sources → plasma species → metabolic sinks. Hover for exact flux values. The oral E2 Sankey makes the "most of the dose enters as already-conjugated estrogens, not as free E2" point visually: the largest flow on the diagram is into E1S, not into free E2.
Source code — Python in ./model/: v1_basic.py, v2_dynamics.py, v3_calibrated.py, v4_with_EE.py. Each is runnable; each prints its own validation table.
No real tissue compartments. Adipose, breast, brain, uterus all lumped into systemic plasma. Tissue concentrations can't be predicted.
No portal vein as a real compartment. Oral/SL first-pass amplification is a 50× multiplier on hepatic free E2 during absorption — a coarse heuristic.
No CYP catechol pathway. 2-OH-E2, 4-OH-E2, 16α-OH-E2 lumped into "other clearance".
No enterohepatic recirculation. Gut bacterial β-glucuronidase reactivation step is absent. Probably under-predicts oral apparent half-life by some amount.
No estriol pathway. Pregnancy is lumped placental E2/E1 input; the actual DHEA-S → E3 chain isn't there.
No inter-individual variability. Single deterministic trajectory. Real PK has CV ~30–60% on most parameters.
SHBG model is rough. Three-pathway scheme calibrated, but pregnancy SHBG still under-predicts by 40%; would need an explicit placental SHBG production term (some of pregnancy SHBG rise is HCG-driven, not E2-driven).
11The prodrug solution: EC508 and the sulfamate strategy
Now the chemistry from the very beginning of the original conversation makes sense in context. The pharmacology problem is:
We want an oral estradiol formulation that delivers physiological systemic E2 levels without producing the hepatic ER-α saturation that drives VTE risk. Transdermal works but is inconvenient and expensive. Can we design a prodrug that's taken orally but acts pharmacokinetically like transdermal?
The strategy: design a prodrug that's absorbed orally but sequestered into red blood cells as it crosses the gut wall, so it's carried past the liver in the cellular compartment rather than as free drug in plasma. Once in systemic circulation, slow plasma esterase hydrolysis releases active E2 at low concentrations that the liver clears one circuit at a time without saturation.
The mechanism for RBC sequestration: bind tightly to carbonic anhydrase II (CAII), which sits at high concentrations inside erythrocytes. The CAII-binding pharmacophore is a sulfamoyl group (–SO₂NH₂) — the sulfamate nitrogen ligates the active-site zinc of CAII.
The first attempt: E2MATE (estradiol-3-sulfamate). The C3 phenolic oxygen esterified with a sulfamate group, so the molecule both (a) is protected from C3 conjugation by SULT/UGT and (b) binds CAII. It worked for absorption and CAII binding. But the C3-O-SO₂NH₂ bond is also recognized by steroid sulfatase (STS) — and instead of being cleaved cleanly to release E2, the sulfamate group irreversibly inhibited STS via mechanism-based covalent modification: STS uses an active-site formylglycine residue (a modified cysteine) for catalysis, and the sulfamoyl group transfers onto that residue and stays there, blocking the active site permanently. This destroyed STS activity throughout the body, preventing both the drug's own activation to E2 and the normal reactivation of the body's E1S reservoir. E2MATE was repurposed as an STS inhibitor for endometriosis.
The redesign: EC508 = estradiol-17β-(1-(4-(aminosulfonyl)benzoyl)-L-proline). Move the sulfamoyl group off the C3 oxygen — where STS attacks — and onto a separate handle attached at C17 via an esterase-cleavable linker. The estradiol is intact; the sulfamoyl head is held away on a proline spacer; plasma esterases slowly release E2 from the C17 ester bond.
EC508's modular architecture, drawn correctly. The estradiol (left, neutral ink) is the active drug — C3-OH preserved, only the C17-OH is esterified. The C17 ester linkage (coral) is cleavable by plasma esterases, releasing free E2 over hours. The L-proline (blue) provides the linker: its Cα carries the ester group and its ring N carries the acyl group toward the benzene head — the explicit Cα is the connection point of the amino-acid ester (an earlier rendering of this figure mistakenly bonded the ester C directly to N, which would have made a carbamate, not an amino-acid ester). The pyrrolidine ring is 5-membered (also misdrawn before — proline is not a 6-membered ring). The benzene ring at the right carries a para-sulfamoyl group (–SO₂NH₂); the sulfamate nitrogen ligates the active-site Zn²⁺ of carbonic anhydrase II inside red blood cells. The molecule therefore crosses the gut as a normal small molecule, hides inside RBCs during portal transit, then slowly hydrolyzes to free E2 in the systemic compartment — oral administration with transdermal-like PK.
The proline linker is what the original conversation synthesized in the Boc/Cbz protection chemistry section. The Steglich esterification joins L-proline's COOH to estradiol's C17-OH; the 4-sulfamoylbenzoyl group is attached to proline's nitrogen. Boc and Cbz both protect proline's N during the Steglich step, then come off later — Boc by TFA, Cbz by H₂/Pd hydrogenolysis. The synthesis chemistry exists specifically because this molecule is one of the few rational solutions to the hepatic-saturation problem.
The disappointing update: development status EC508 was developed by Evestra Pharmaceuticals. As of 2021, the transfemscience.org EC508 article notes "No Further Development." It never progressed to human clinical trials. The reasons aren't entirely public, but small-pharmaceutical-company funding constraints are the most likely explanation. The chemistry works in principle and in animals; the molecule simply didn't find a developer willing to take it through Phase I–III trials.
12The whole picture in one diagram
The complete synthesis. Each column is one drug form; rows trace the causal chain enzymes → hepatocyte concentration → SHBG induction (via the three-pathway model) → VTE risk. The key insight is unchanged from the original: plasma E2 and VTE risk are mediated entirely by what the hepatocyte sees, which depends on route, not just dose. Transdermal, IM, and SC keep the hepatocyte below threshold. Oral, sublingual, and EE all push it into saturation by different mechanisms (first-pass bolus, repeated systemic exposure, metabolic resistance). EC508 is the experimental attempt to break the link.
13Rebuilt confidence: what we know, what we don't
Closing with explicit confidence levels for each major claim, refreshed after the fact-checks:
High confidence well-established
The molecular pharmacology of estradiol: structure, IUPAC numbering, the two vulnerable hydroxyls, their pKa and reactivity.
The major enzyme families and basic kinetics: HSD17B1/2, SULT1E1, UGT1A1/1A10/2B7, CYPs, STS. Tissue distribution, cofactor requirements, substrate specificity.
Oral E2 pharmacokinetics: ~5% bioavailability for free-E2 AUC; ~13–20 h apparent half-life; dominant E1S reservoir.
The E1:E2 ratio as a route signature: ~1:1 with transdermal/cycling, 5:1+ with oral.
Hepatic ER-α Kd ~0.25 nM (Yager 1989). Note: rat hepatocyte; not necessarily the same in human, and not the SHBG-induction EC50.
ESTHER (Canonico 2007) VTE numbers: oral 4.2×, transdermal 0.9×. Replicated direction (not magnitude) across populations.
The pregnancy fact pattern: plasma E2 ~250× baseline; SHBG 5–10×; fibrinogen 2×; VTE incidence 3–10× during pregnancy proper.
The EE structural advantage that creates its disadvantage: 17α-ethinyl blocks HSD17B2 oxidation; ~45% oral bioavailability; ~100× per-mole hepatic SHBG potency (Kuhl 2005).
SHBG Kd for E2 ~20 nM (Hammond, Avvakumov 2010). The 1 nM number is for DHT, not E2.
Postmenopausal endogenous E1 production ~40 μg/day (Longcope 1986; Grodin 1973). The 80 μg/day figure used by the old AI was about 2× too high.
The SULT1E1 ↔ STS sulfation/desulfation cycle as the tissue-switching mechanism; E1S as the inactive currency.
Medium confidence defensible inference
The quantitative attribution of the 250× → 3–10× pregnancy attenuation cascade. Each mechanism is well-supported; the multiplicative weights are my synthesis, not a single validated model.
The gut-wall metabolism fraction of ~40% for E2. The 0.44 figure from Back 1982 is for EE in human portal vein, not E2 directly. Inferred to be similar or higher for E2; limited direct human portal-vein data.
The SHBG induction EC50 of ~1500 pg/mL free hepatic E2 used in the v4 model. This is a calibration target chosen so the model reproduces oral E2 dose-response data (Lindberg 2005), not a directly-measured parameter. The HepG2 dose-response for E2 on SHBG (Mercier-Bodard 1999) suggests responses at 250 nM–2.5 μM — orders of magnitude higher than 1500 pg/mL (~5.5 nM). The model EC50 is best read as "the integrated-exposure threshold at which oral E2 produces measurable SHBG rises in humans," which is a different beast from an in vitro EC50.
The hepatocyte intracellular [E1]/[E2] ratio of ~5–20 during oral first-pass. Plasma E1/E2 of ~5 is observed; intracellular has never been directly measured.
The v4 model's portal-vein amplifier of 50× hepatic over systemic. Coarse heuristic; a real PBPK would integrate portal flow × concentration over the absorption time course.
The "three-pathway SHBG induction" model. Each pathway is fit to its scenario; the additive composition is my framing.
Lower confidence limited or indirect evidence
VTE risk for sublingual E2 specifically. No outcome studies. Inferred to be similar to oral from indirect markers (E1 levels, SHBG, protein S). The Bar 2024 protein S finding is preliminary (conference abstract).
The theoretical performance of EC508 in humans. Animal data shows 100% bioavailability and minimal hepatic effects, but no human trials. Mechanism is sound; human PK could differ.
The in-vivo Hill coefficient for hepatic ER-α → SHBG. No paper has fitted this. n ≈ 1.0 is the default assumption; actual value could be 0.7–1.5.
The "above SHBG EC50 → hepatic effect" rule in detail. Hepatic estrogen effects are graded, depend on portal vs systemic concentrations, time integration, metabolite contributions (E1 also activates ER), and probably distinct genes' response shapes.
Whether protein S responds to peak free E2 (Bar 2024) or to integrated AUC. The mechanism is plausible but unvalidated.
The cytoplasmic [E1]/[E2] = 11 derivation from NAD⁺/NADH × Keq. The arithmetic is correct given the inputs, but both inputs (NAD⁺/NADH = 700; E°' for E1/E2 = −0.265 V) are shaky. The qualitative point (hepatocytes oxidize most E2 to E1) is right; the precise factor of 11 is not.
The honest meta-conclusion, revised. Estrogen pharmacokinetics is unusually well-mapped for an endocrinology topic. The basic enzyme biochemistry and population-level PK numbers have been stable since the 1980s–1990s and the recent fact-check passes didn't perturb them, only the chains of inference built on top. Where the field is genuinely advancing: (a) precise dose-response and saturation kinetics for hepatic ER-α and SHBG induction, important for safer formulation design; (b) the microbiome's role in enterohepatic recirculation; (c) the puzzle of why sublingual doesn't behave the way first-pass theory predicts; (d) prodrug strategies like EC508 that attempt to solve the route-of-administration problem chemically rather than clinically. Most practical clinical questions have known answers. The remaining open questions sit at the boundaries — sublingual safety, novel prodrugs, dose-response at extremes — and these are exactly where confidence was flagged medium or low above.
This re-synthesis integrates: the original synthesis (linked in the meta-strip above), the v4 PK model writeups (fact-check summary, v3 architecture, v3 diff, v4 extensions), the Claude and codex fact-check reports in ./research/, the sublingual correction, the e1s reservoir dynamics, the VTE quantitative model, the EE parameter scan, and the published PK/PBPK model survey. Key references: Kuhl 2005 (Climacteric); Stanczyk 2013, 2024 (Contraception); Yager & Williams 1989 (Cancer Res); ESTHER (Canonico 2007, Circulation); Hammond et al. / Avvakumov 2010 (SHBG affinity); Mercier-Bodard 1999 (HepG2 E2 dose-response on SHBG, replacing the previously-cited Selva & Hammond 2009 which was misattributed); Longcope 1968 (J Clin Invest); Ruder 1972 (E1S kinetics); Doll 2022 (Endocr Pract, sublingual LC-MS/MS); Bar 2024 (ECE EP592, protein S); Cirrincione 2021 (LGBT Health); Stegeman 2013 (JTH, SHBG in COCs); Lorbek 2018 PBPK; Klipping 2012 pop-PK; Wikipedia "Pharmacokinetics of estradiol" and "Ethinylestradiol" articles as well-referenced indices into primary literature; the transfemscience.org EC508 article. All numbers are central estimates; inter-individual variation in real populations is 4–6 fold for most PK parameters and substantial for clinical outcomes. AI-generated, AI-fact-checked, not clinically validated.