A multi-species kinetic model of oral, transdermal, sublingual, IM, sub-Q and COC estrogen administration, with E2 / E1 / E1S / EE / SHBG tracked as state variables. Built on top of (and corrects) an earlier AI chat-bot analysis of the same topic.
synthesis.html → tight reference with inline C1–C5 confidence tags on every claim
evidence.html → primary-data figures + 64 direct source quotes
reference.html → glossary, abbreviations, parameter definitions, 13 chemical structures
synthesis-narrative.html → the long narrative version (preserved, less rigorously source-tagged)
The synthesis cross-links to evidence and reference for verification. Every load-bearing claim has a confidence tier and a primary-source link. Best entry point for new readers: synthesis.html.
Open interactive time-animation viewer →
Pick a scenario, scrub through time, watch concentrations and metabolic fluxes update live. ECG-like display, model output annotated with ratio-vs-literature-anchor in real time.
One per scenario. Open the
v4 figures folder and click any
sankey_*.html.
Steady-state mass flow (µg/day) from sources through plasma species to metabolic sinks. Hover any flow to see the exact flux value.
The previous AI's notes had ~8 substantial errors (SHBG Kd, ESTHER OR, PMP E1 production rate, sublingual Tmax, …). Two independent agents reconciled the corrections; they agreed on every major call.
v4 extensions (EE + SHBG +
new routes) →
v3 architecture & parameters →
Diff from old AI v3 →
11 of 12 scenarios within 2× of literature anchors. The one failure (sublingual E1S 2.18×) is against a literature anchor that is itself genuinely uncertain.
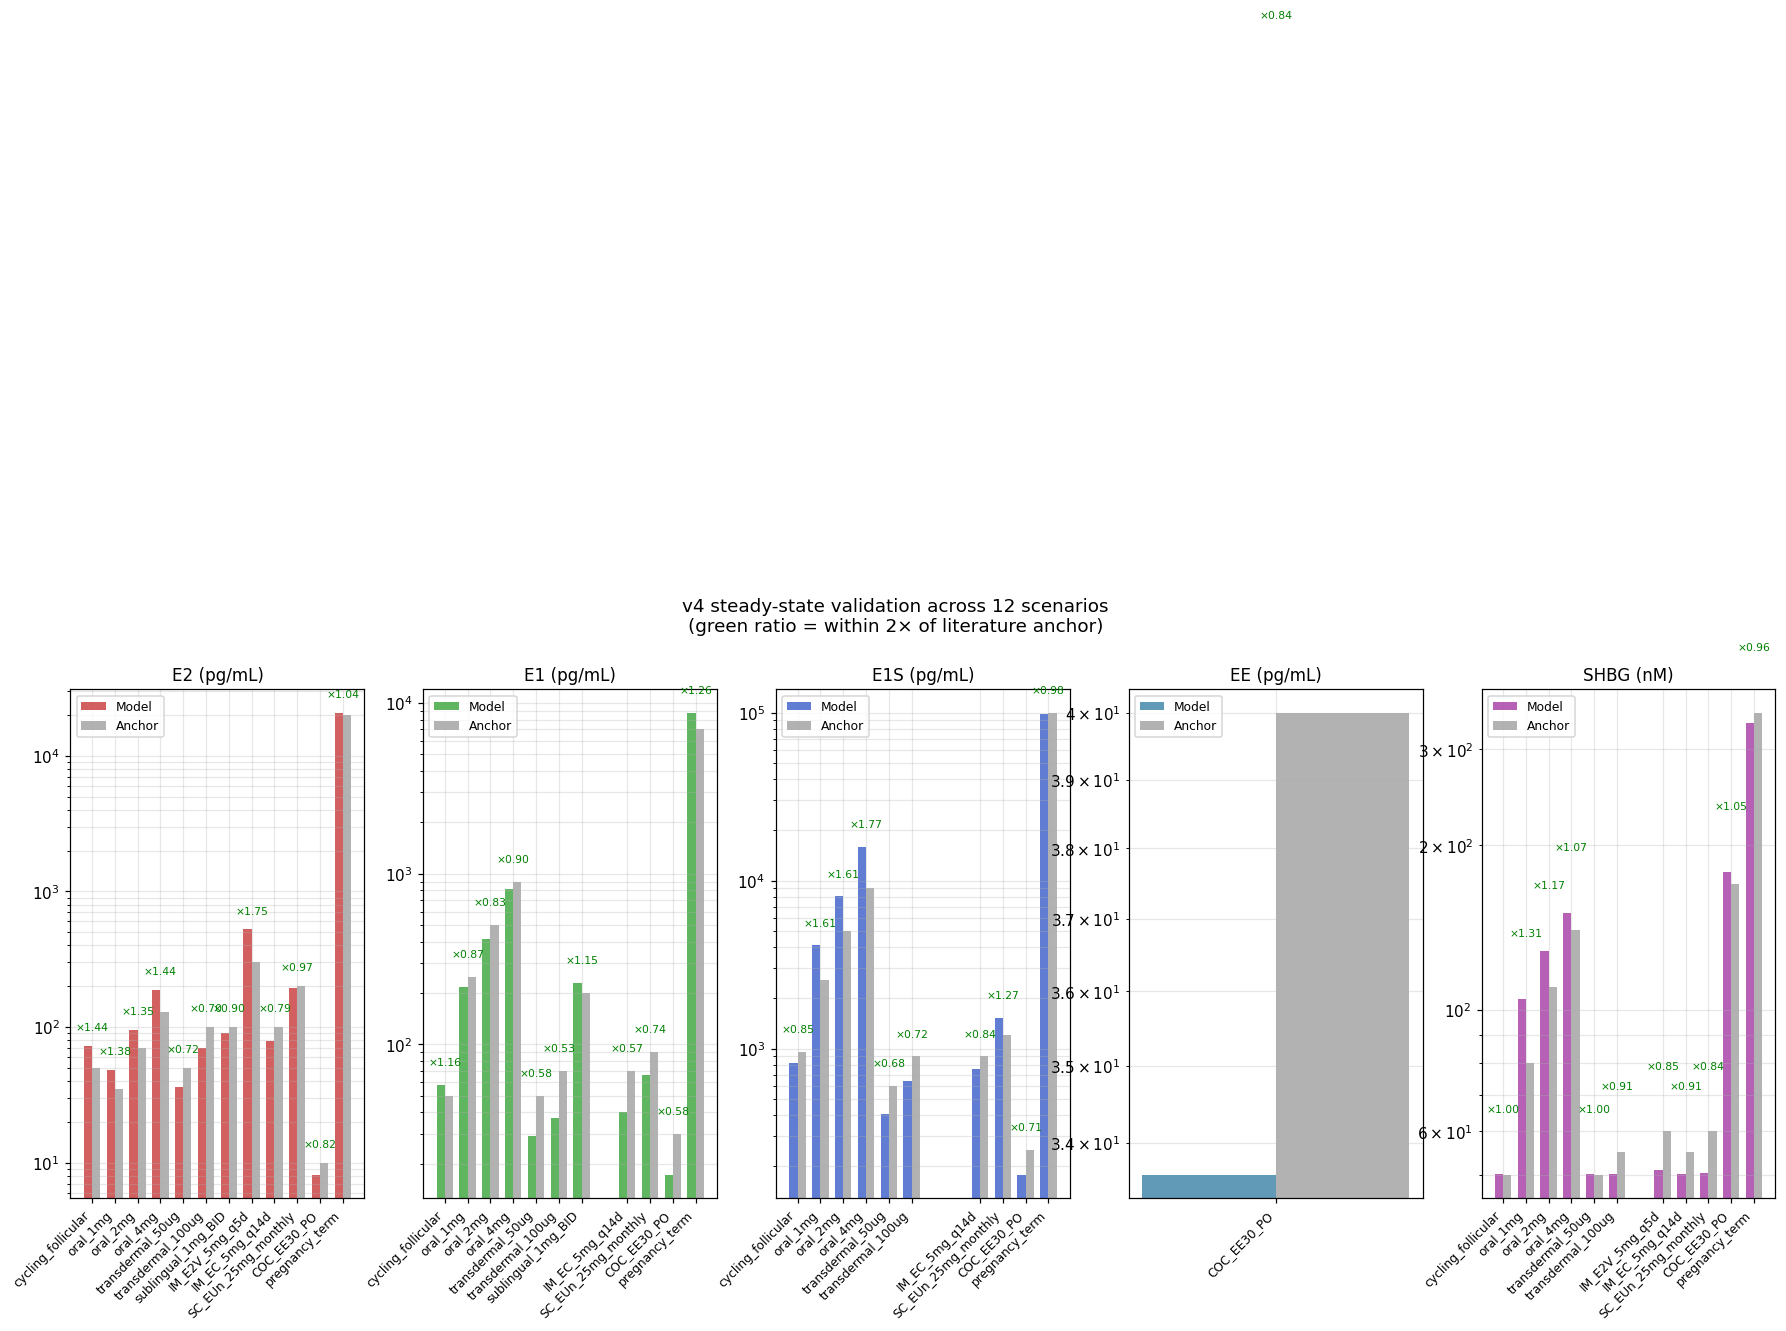
| Scenario | E2 model / anchor | E1 m/a | E1S m/a | EE m/a | SHBG m/a (nM) |
|---|---|---|---|---|---|
| cycling_follicular | 72/50 ×1.44 | 58/50 ×1.16 | 819/960 ×0.85 | — | 50/50 ×1.00 |
| oral_1mg | 48/35 ×1.37 | 218/250 ×0.87 | 4096/2560 ×1.60 | — | 105/80 ×1.31 |
| oral_2mg | 94/70 ×1.34 | 414/500 ×0.83 | 8013/5000 ×1.60 | — | 129/110 ×1.17 |
| oral_4mg | 186/130 ×1.43 | 807/900 ×0.90 | 15825/9000 ×1.76 | — | 150/140 ×1.07 |
| transdermal_50ug | 36/50 ×0.72 | 29/50 ×0.58 | 409/600 ×0.68 | — | 50/50 ×1.00 |
| transdermal_100ug | 70/100 ×0.70 | 37/70 ×0.53 | 644/900 ×0.72 | — | 50/55 ×0.91 |
| sublingual_1mg_BID | 139/100 ×1.39 | 333/200 ×1.66 | 6537/3000 ×2.18 | — | 106/80 ×1.32 |
| IM_E2V_5mg_q5d | 393/200 ×1.97 | 113/200 ×0.56 | 2841/1500 ×1.89 | — | 51/60 ×0.85 |
| IM_EC_5mg_q14d | 79/100 ×0.79 | 40/70 ×0.57 | 758/900 ×0.84 | — | 50/55 ×0.91 |
| SC_EUn_25mg_monthly | 193/200 ×0.97 | 66/90 ×0.74 | 1519/1200 ×1.27 | — | 50/60 ×0.84 |
| COC_EE30_PO | 8.2/10 ×0.82 | 17/30 ×0.58 | 178/250 ×0.71 | 34/40 ×0.84 | 179/170 ×1.05 |
| pregnancy_term | 20672/20000 ×1.03 | 8133/7000 ×1.16 | 53658/100000 ×0.54 | — | 211/350 ×0.60 |
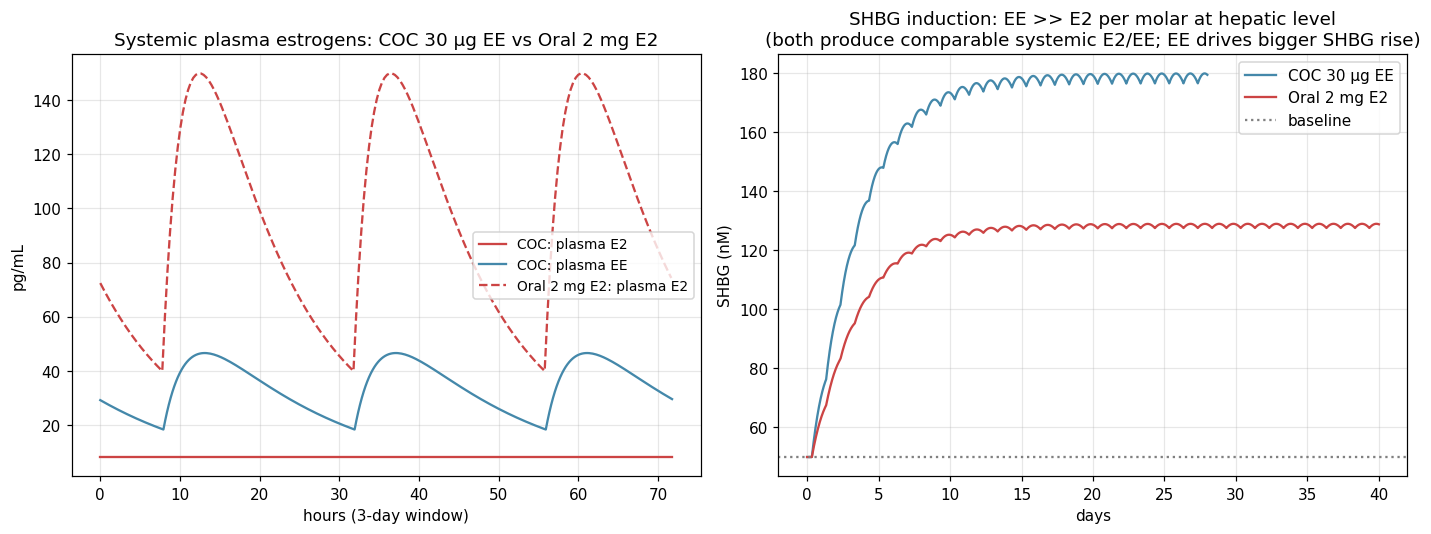
The right panel above is the punchline of the COC story: a 30 µg/day EE dose gives plasma estrogen (EE) similar to what oral 2 mg E2 gives, but SHBG rises ~50% more than with oral E2. Per molar at the hepatic level, EE is ~100× more potent than E2 at SHBG induction, because the 17α-ethinyl group blocks the 17β-HSD2 inactivation step that "uses up" oral E2 on first pass.
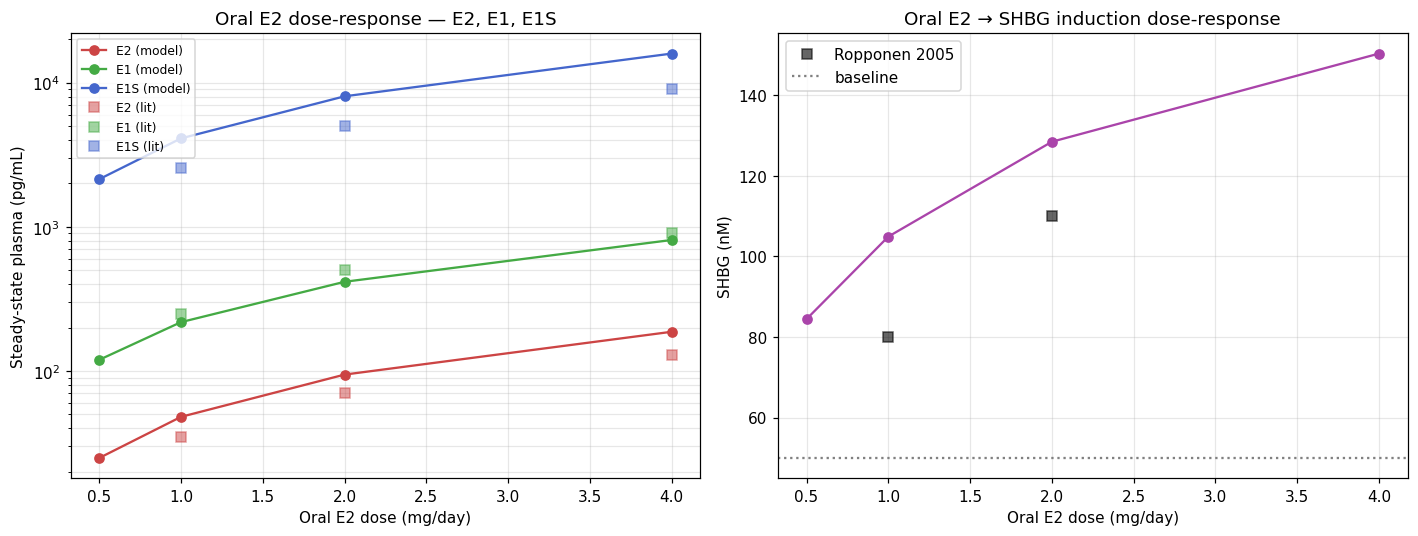
Model predictions vs Kuhl 2005 / Lindberg 2005 anchors. Linear in E2/E1/E1S across the 1–4 mg range; SHBG response is sub-linear (Hill saturation).
The previous chat-bot analysis (saved in
old-ai-analysis/conversation.md and the HTML artifacts) had
the right qualitative picture but ~8 substantial errors that propagated
through its v3 kinetic model. Two independent fact-checking agents
(Claude and GPT/codex via the codex CLI in a tmux session) caught the same
major issues. Full list →
Most important:
writeup/ — final markdown reportsresearch/ — fact-check reports + literature scansmodel/ — Python code + figuresmodel/figures/v4/ — Sankey HTMLs + interactive viewer +
validation plotsold-ai-analysis/ — original chat-bot conversation
(kept for comparison)Generated by Claude Opus 4.7 in a /workspace/trans/estradiol session, 2026-05-14. AI-generated, AI-fact-checked, not personally verified.