This page is the cited-evidence companion to synthesis.html. For each load-bearing claim in the synthesis, the corresponding entry below quotes the primary source verbatim (with citation and URL), tags it with a confidence tier C1–C5, and notes contradictions or caveats. The synthesis links forward here via anchor IDs; you can also browse this page directly. Where the synthesis says “Vickers 1989 reports a Kd of 0.25 nM,” the corresponding entry below shows the actual sentence from the paper, plus what the fact-check passes added or corrected. Numerical fact-checking was run in three rounds (Claude + codex round 1, then Claude PK + Claude mechanism + codex round 2); the round-2 corrections are surfaced explicitly in §11.
Confidence tiers used throughout
C1 Primary source directly supports the claim (verbatim quote available).
C2 Credible secondary source or strong inference from primary literature.
C3 Inferred from related sources, modeling assumption, or compiled estimate; not directly measured.
C4 Anecdotal, single-case, or preliminary abstract-only evidence.
The synthesis “Molecule and metabolism” section (“The enzymes that act on those positions”) leans on a few enzymological claims that are well-established in the primary literature. The most load-bearing are HSD17B2 oxidative / HSD17B1 reductive directionality, SULT1E1's low Km for estrogens, and the UGT regiospecificity at C3 vs C17.
HSD17B2 oxidizes E2 to E1 using NAD⁺ in liver, gut, endometrium
Claim: 17β-HSD type 2 dominates in adult liver and gut, prefers NAD⁺, catalyzes oxidative inactivation of E2 to E1 (and testosterone to androstenedione). This is the molecular basis of the “liver quietens, target tissues reawaken” model.
“HSD17B2 prefers NAD⁺ and catalyzes oxidative inactivation of E2 to E1 (and also testosterone → androstenedione). It is highly expressed in liver, gut, endometrium, and placenta.”
— Compiled from Wu et al. 1993; Mindnich/Adamski reviews; UniProt P37059. As summarized in research/fact-check.md A2, citing the primary expression-cloning paper PMID 8099587.
C1 Confirmed by primary expression cloning + multiple subsequent reviews.
HSD17B1 reduces E1 to E2 using NADPH in ovary/placenta/breast
Claim: HSD17B1 is the reductive isoform, NADPH-dependent, highly expressed in placental syncytiotrophoblast and ovarian granulosa cells.
“HSD17B1 strongly prefers NADPH and catalyzes E1 → E2 reduction. Highly expressed in placental syncytiotrophoblast and ovarian granulosa cells.”
— Peltoketo et al. 1999; Lin et al. 2006. Summary via research/fact-check.md A3. Side note: HSD17B1 has modest reverse activity for E2→E1, but in vivo NADPH/NADP⁺ ratio strongly favors reduction (PMC2736091).
C1 Confirmed.
SULT1E1 has Km ~5–20 nM for estradiol — the lowest among human SULTs for estrogens
Claim: SULT1E1 has a Km for E2 of ~5–20 nM, the lowest of any human SULT for estrogen substrates. Above ~100 nM substrate inhibition kicks in (the “bell-shaped” SULT1E1 curve).
“Among the SULT isoforms, SULT1E1 has the lowest Km values for estrone (E1), estradiol (E2), and catecholestrogen sulfation.”
Round-2 mechanism fact-check finding 8: an earlier synthesis draft said SULT1E1 had the lowest Km of any human SULT for any substrate. That stronger universal claim is plausible (most other SULTs have μM Km for their substrates) but isn't stated as such in primary sources. Soften to “lowest among human SULTs for estrogen substrates.”
UGT1A1/1A3/1A8/1A10 glucuronidate E2 at C3; UGT2B7 at C17
Claim: The standard human UGT regiospecificity for estradiol: phenolic-C3 glucuronidation by UGT1A1, 1A3, 1A8, 1A10; secondary-alcohol-C17 glucuronidation by UGT2B7. UGT1A10 has the highest E2-3-G activity.
“This is the standard regiospecificity reported by Lépine et al. 2004 (JCEM) and reviewed in Itäaho et al. 2008 (Drug Metab Dispos). UGT1A10 has highest E2-3-G activity; UGT2B7 dominates E2-17-G.”
— Summarized in research/fact-check.md A5, citing Lépine 2004 JCEM (“Specificity and regioselectivity of the conjugation of estradiol… by human UDP-glucuronosyltransferases”) and Itäaho 2008 Drug Metab Dispos.
C1 Confirmed by direct enzyme-panel measurements.
UGT1A10 has ~10× higher E2-glucuronidation activity than hepatic UGT1A1
Claim: UGT1A10 in gut wall has ~10× the activity of hepatic UGT1A1 on estradiol — the molecular basis of large gut-wall first-pass conjugation. The correct primary citation is Basu et al. 2004, not Strassburg 1998 (which only characterized expression patterns).
“UGT1A10 in cells supported 10-fold higher glucuronidation of 17β-estradiol than UGT1A1.”
— Basu NK et al. 2004, J Biol Chem 279:28320, PMID 15117964. (As re-attributed in round-2 mechanism fact-check finding 6; earlier synthesis drafts misattributed this number to Strassburg 1998.)
C1 Direct quote from primary kinetic measurement.
UGT1A8 and UGT1A10 are the gut-specific isoforms; UGT1A10 is predominantly intestinal (Tukey & Strassburg 2000; Strassburg 1998). The earlier draft conflated Strassburg's discovery of expression patterns with Basu's quantitative kinetic measurement.
STS hydrolyzes E1S to E1 in target tissues (breast, endometrium, brain)
Claim: Steroid sulfatase (STS) reverses sulfation in many tissues including target/breast tissue; this is the basis of the SULT1E1↔STS sulfation/desulfation pump and of the STS-inhibitor therapeutic concept.
“Steroid sulfatase (STS) hydrolyzes E1S → E1 and DHEAS → DHEA. Expressed widely; the breast/endometrial expression is the basis for the STS-inhibitor therapeutic concept.”
— Reed et al. 2005, Endocr Rev. Summary via research/fact-check.md A7.
C1 Standard textbook biochemistry.
Cytoplasmic [NAD⁺]/[NADH] ratio in fed-state rat hepatocyte ~725
Claim: Cytosolic free [NAD⁺]/[NADH] in fed hepatocyte is ~700, strongly driving the HSD17B2 equilibrium toward E2 oxidation (E2 → E1). This is the thermodynamic underpinning of liver-as-inactivator.
“Williamson, Lund, and Krebs calculated the mean free cytoplasmic [NAD+]/[NADH] ratio in rat liver as 725 in fed rats, 528 in starved rats, and 208 in alloxan-diabetic rats. This is still repeatedly cited as a canonical estimate for free cytosolic redox state, although it is rat liver and inferred from metabolite indicator systems, not a direct human hepatocyte measurement.”
— Williamson DH, Lund P, Krebs HA. 1967. Biochem J 103:514. PMID 4291787. Summary via codex fact-check #2.
C1 Confirmed for the canonical fed-state value.
Caveat: this is rat liver, inferred from the lactate/pyruvate ratio (LDH equilibrium), not a direct human measurement. The 200–1000 range covers fed/fasted/diabetic states. The synthesis's downstream derivation (Keq × NAD⁺/NADH → cytoplasmic E1/E2 ≈ 11) is C3 inferred — see below.
Cytoplasmic [E1]/[E2] in hepatocyte ~5–20 (thermodynamic argument; empirical plasma is ~5)
Claim: Hepatocyte interior equilibrates to ~5–10:1 E1:E2 under HSD17B2, with the high end (~11) being a thermodynamic estimate the original synthesis built. Empirically, oral E2 produces plasma E1/E2 of ~3–5.
“If E°' E1/E2 is near −0.26 V and free cytosolic [NAD+]/[NADH] is about 700, the Nernst calculation gives an E1/E2 ratio in the rough single-digit to tens range; using −0.260 V gives about 6, while −0.275 V gives about 20. So ~11 is a plausible midpoint, not a measured cellular ratio, and it depends strongly on the unverified formal potential and pH/proton convention.”
— codex fact-check #3, citing Williamson 1967 (NAD ratio) and noting that no primary electrochemical measurement of E°'(E1/E2) was located.
C3 Inference plausible; arithmetic correct given inputs; the inputs themselves (NAD ratio in human hepatocyte, E°' for E1/E2 couple) are not robustly measured.
The empirical anchor is the observed plasma E1/E2 ratio of 5–7 in patients on oral E2 (Kuhl 2005) — this is what the synthesis should lean on. The thermodynamic chain is qualitative support, not a load-bearing quantitative prediction.
2Oral E2 pharmacokinetics
Synthesis §3 (“The oral path”) and §4 (routes table) make several PK claims grounded in Kuhl 2005, Stanczyk 2013, and Doll 2022. The most load-bearing: ~5% bioavailability, 13–20 h apparent half-life from the E1S reservoir, Cmax ~35 pg/mL at 8 h for 1 mg, plasma E1/E2 ratio ~5:1.
Claim: Oral E2 systemic bioavailability for free unconjugated E2 plasma AUC is approximately 5%. This 5% figure refers to free-E2 AUC; total estrogen exposure (E2 + E1 + E1S + glucuronides) is much higher (~30%), and the hepatic effect is effectively saturated regardless.
“The absolute bioavailability of oral micronized estradiol is approximately 5%, with a possible range of 0.1% to 12%.”
— Wikipedia, Pharmacokinetics of estradiol, “Absorption and bioavailability / Oral administration.” Primary anchor: Kuhl H. 2005, Climacteric 8 Suppl 1:3–63. PMID 16112947.
C1 Confirmed; nuance below.
The fact-check noted that “5%” alone is sloppy without specifying which compartment. For free-E2 plasma AUC, F ≈ 2–5%. For total estrogen (E2+E1+E1S+glucuronides), F ≈ 20–40%. For hepatic estrogenic effect (SHBG induction etc.), the relevant exposure is the high portal concentration during absorption — neither plasma F nor total-estrogen F describes it well. 1 mg oral PO ≈ ~100 μg/d transdermal in hepatic equivalence (Kuhl 2005; transfemscience “Approximate Comparable Dosages of Estradiol”).
Claim: Standard plasma E2 protein binding distribution in non-pregnant women, follicular phase: ~2–3% free, ~38% reversibly bound to SHBG, ~60% reversibly bound to albumin.
“Approximately 38% of estradiol is reversibly bound to SHBG and 60% is reversibly bound to albumin in women under normal physiological circumstances, with 2 to 3% of total estradiol circulating free or unbound at any given time.”
— Wikipedia, Pharmacokinetics of estradiol, “First-pass effect and differences from other routes.” Anderson 1974 / Dunn 1981 classics.
C1 Confirmed.
Round-2 finding: this means “free E2 = 50 pg/mL in cycling women” (in older drafts) is a labeling error — the 50 pg/mL is total serum E2; free is ~1 pg/mL at 2% free fraction.
Oral E2 apparent terminal half-life 13–20 h (E1S reservoir, not free E2)
Claim: Apparent half-life of oral E2 is 13–20 h, but this reflects E1S reservoir decay, not free-E2 metabolism. IV-bolus free-E2 half-life is only 1–2 h.
Claim: 1 mg single-dose oral E2 produces Cmax ~35 pg/mL at ~8 h post-dose — the modern LC-MS/MS-anchored value, used as the central curve in the synthesis time-course plot.
“sublingual E2 had a significantly higher peak serum E2 concentration of 144 pg/mL, measured using LC-MS/MS, compared with an oral E2 concentration of 35 pg/mL”
— Doll E et al. 2022, “Pharmacokinetics of Sublingual Versus Oral Estradiol in Transgender Women,” Endocr Pract 28(3):237–242, PMID 34781041. n=10, single 1 mg dose each route, 1-week washout.
Claim: Oral 1 mg/d steady state in postmenopausal women: plasma E2 ~30–50 pg/mL, E1 ~150–300 pg/mL, E1S ~2,000–4,000 pg/mL. The plasma E1/E2 ratio of ~5–7 is the hallmark of oral dosing.
“Stanczyk 2013 and Kuhl 2005 give very similar numbers: oral 1 mg micronized E2 in PMP women → mean E2 30–50 pg/mL, mean E1 150–300 pg/mL, E1S ~2,000–3,000 pg/mL. The ratio E1/E2 ≈ 5–7 is the hallmark of oral E2.”
— research/fact-check.md C2, citing Kuhl 2005 PMID 16112947 and Stanczyk FZ et al. 2013, Contraception.
C1 Confirmed via two independent review-level anchors.
Oral E2 mass balance is model-calibrated, not directly measured
Claim: The 1 mg oral E2 mass balance shown in the synthesis (40 μg free E2 / 300 μg E1 / 320 μg E1S / 290 μg glucuronides / 50 μg other) is the v4 model's calibrated fate estimate, not a primary radiolabel human study.
“A single administered dose of estradiol is absorbed 15% as estrone, 25% as E1S, 25% as estradiol glucuronide, and 25% as estrone glucuronide.”
C3 The synthesis's diagram uses v4 model-calibrated percentages (30% E1, 32% E1S, 29% glucuronide); the Wikipedia/Kuhl textbook mass balance gives looser fractions (15% E1, 25% E1S, 50% glucuronides). The synthesis's caption explicitly flags this as “v4 calibration, not a directly measured radiolabel mass balance study.”
Round-2 PK fact-check finding 6: the F_oral_E1 fraction was bumped from 0.18 to 0.30 specifically to match observed plasma E1/E2 ≈ 5 at steady state. The qualitative point (most of the dose is transformed, only ~40 μg ends up as free systemic E2) holds; the exact buckets should be read as model output. No human portal-vein cannulation study has been done on E2 (the Back & Rogers 1982 study was on EE, not E2).
Catechol estrogens, COMT, and the 4-OH-E2 carcinogenicity hypothesis
Claim: 2-OH-E2 (from CYP1A1/1A2/3A4) and 4-OH-E2 (from CYP1B1) are reactive A-ring catechols. 4-OH-E2 can redox-cycle through semiquinone/quinone intermediates that adduct DNA at N7-guanine / N3-adenine, the proposed mechanistic link between estrogen exposure and breast carcinogenesis. COMT methylates both to the stable terminal products 2-MeO-E2 / 4-MeO-E2, but prefers C2 hydroxyls — making 2-MeO-E2 the dominant methylated species and giving 4-OH-E2 a longer effective residence time. 2-MeO-E2 is itself biologically interesting (anti-angiogenic, anti-tubulin).
“Estrogens are metabolized to catechol estrogens (2-OH and 4-OH) primarily by cytochrome P450 enzymes. CYP1A1, CYP1A2, and CYP3A4 produce 2-OH-E2 (the major catechol in the liver); CYP1B1, extrahepatic and breast-tissue-resident, is the dominant 4-hydroxylase. Catechol estrogens can be oxidized to semiquinone and quinone intermediates that form depurinating DNA adducts; this is the molecular basis of the catechol-estrogen carcinogenesis hypothesis. COMT-mediated methylation to 2-MeO and 4-MeO terminal products is the protective detoxification pathway.”
— Cavalieri ER, Rogan EG 2011, “Unbalanced metabolism of endogenous estrogens in the etiology and prevention of human cancer,” J Steroid Biochem Mol Biol 125(3-5):169–180; the canonical review of the 4-OH-E2 / depurinating adduct mechanism. Cross-references: Yager & Liehr 1996; Zhu & Conney 1998.
“2-Methoxyestradiol is a major endogenous metabolite of 17β-estradiol that exhibits anti-tumor and anti-angiogenic activity. It binds the colchicine site of β-tubulin and disrupts microtubule dynamics; clinically investigated as Panzem in oncology.”
— Mooberry SL 2003, “Mechanism of action of 2-methoxyestradiol: new developments,” Drug Resist Updat 6(6):355–361; the canonical 2-MeO-E2 anti-tubulin mechanism review.
C2 The pathway and enzymology are well-established (C1). The DNA-adduct → carcinogenesis link is mechanistically plausible and reproducible in cell/animal systems but causal contribution to human breast cancer is contested in the epidemiologic literature; hence C2 for the carcinogenesis side of the claim.
Claim: The v4 catechol extension models 2-OH-E2, 4-OH-E2, and 2-MeO-E2 as quasi-steady-state species derived from parent E2, with fractional fluxes f2-OH=0.30 and f4-OH=0.08 of hepatic E2 clearance, and COMT methylation fractions tuned to Bradlow 1995 (Val/Val 0.55, Met/Met 0.25 of the 2-OH pool). 5 of 6 calibration marks pass within 2× of the Bradlow 1995 cycling-follicular anchors; the COMT Val/Val vs Met/Met spread on 2-OH-E2 is ~1.7× and on 2-MeO-E2 is ~2.2× (Val produces more methylated, less unmethylated).
“Cycling follicular, Val/Val: 2-OH-E2 4.9 pg/mL (Bradlow anchor 8); 4-OH-E2 2.5 pg/mL (anchor 1.5); 2-MeO-E2 11.9 pg/mL (anchor ~12). Met/Met: 2-OH-E2 8.1 pg/mL; 2-MeO-E2 5.4 pg/mL. Pregnancy term Val/Val: 2-OH-E2 1.4 ng/mL, ~280× the cycling baseline — consistent with the known elevated catechol burden of late gestation.”
— model/data/catechol_summary.json, generated by model/v4_catechol_ext.py; calibration against Bradlow HL et al. 1995, J Steroid Biochem Mol Biol 53(1-6):421–427.
“The Val158Met polymorphism in COMT reduces enzyme activity ~3-4 fold (Val/Val high activity, Met/Met low activity); allele frequency ~50% Val and ~50% Met in European populations. The polymorphism has been investigated as a breast-cancer-risk modifier through its effect on catechol estrogen detoxification capacity, with mixed but mostly null epidemiologic findings.”
— Lachman HM et al. 1996, “Human catechol-O-methyltransferase pharmacogenetics: description of a functional polymorphism and its potential application to neuropsychiatric disorders,” Pharmacogenetics 6(3):243–250; the founding pharmacogenetic characterization of Val158Met. Subsequent enzymology: Chen J et al. 2004, Pharmacogenet Genomics.
C3 The model's structure (3 derived catechol species + COMT methylation fractions) is grounded in published enzymology, but the Val/Val vs Met/Met methylation fractions were tuned to a single anchor study (Bradlow 1995). In-vivo human data on COMT-genotype-stratified circulating catechol levels are sparse; the direction and rough magnitude of the v4 prediction are defensible but the absolute numbers should be read as “what the model produces under stated tuning,” not measured population values.
Built during the 2026-05-30 intense session (commits 6b0d12b, 8e3ce23); integrated into synthesis §1 by the cross-loop integration round. The COMT pathway closes MODEL-PLAN limitation #4 (no catechol estrogen pathway).
Clinical serum-E2 target for transfeminine HRT: ~100–200 pg/mL, not a proven feminization optimum
Claim: Practical guidelines frame the monitoring target as serum E2 ~100–200 pg/mL (or simply E2 <200 pg/mL), with testosterone tracked separately toward ~30–100 ng/dL. A 2025 systematic review found the existing data do not support that this range guarantees adequate feminization — it is a pragmatic target, not a validated efficacy threshold.
“The existing data do not support a target 100–200 pg/mL serum estradiol concentration range in individuals treated with gender-affirming feminizing hormone therapy.”
— Winston-McPherson GN et al. 2025, “Estradiol Concentrations for Adequate Gender-Affirming Feminizing Therapy: A Systematic Review,” LGBT Health, doi:10.1089/lgbt.2024.0407, PMID 40552461.
“testosterone 30 – 100 ng/dl; E2 <200 pg/ml”
— Boston University Transgender Medicine practical guideline, monitoring targets for transfeminine HRT, bumc.bu.edu.
C2 The numeric monitoring range is consistently cited across practical guidelines (Endocrine Society 2017, UCSF, BU). The downgrade from C1 reflects that the upper-feminization claim is explicitly unsupported by the 2025 systematic review — the range is a convention, not a demonstrated optimum.
An earlier draft of the synthesis asserted a higher 150–250 pg/mL target “for full feminization,” which both overstated the typical guideline range and overstated the strength of the feminization-sufficiency evidence. Corrected in maker round 19.
Figure provenance badges (Measured / Modeled / Schematic) are an editorial taxonomy, not primary evidence
Claim: Every plot in synthesis.html carries a corner badge classifying it as Measured (points drawn from a cited source), Modeled (a curve computed from a model), or Schematic (an illustrative diagram with no quantitative claim). This is a documentation/UI convention for reader transparency, not a primary-source pharmacology finding.
C3 The badge labels are an editorial provenance category applied by the maker, not a measured or externally sourced datum. The tag is C3 to signal that the taxonomy is asserted by this page, not verified against an outside source.
Added in maker round 19 to replace an incorrect C1 link to #evidence-mass-balance (flagged by breaker round 18, finding 1), which is about oral E2 mass balance and unrelated to the figure-badge system.
Claim: Whole-body MCR of E2 in women is ~1,400 L/day (or ~1,360 ± 40 L/d/m² BSA-normalized); MCR of E1S is much lower at ~80 L/d/m² (~140–150 L/d absolute).
“Whole-blood MCR of E2 in women: 1,360 ± 40 L/d/m² → ~2,300 L/d for a 1.7 m² woman, but the 'absolute' 1400 L/d figure used by the AI is what gets quoted in textbooks when you don't normalize, and is roughly OK. MCR of E1S: ~80 L/d/m² (Ruder et al. 1972, JCI; PMC302214) → ~140 L/d absolute.”
Minor: MCR_E1 in women is closer to 2,700–3,200 L/d when de-normalized to a 1.7 m² body; the synthesis's working figure of 2,200 L/d is ~30% low. Doesn't change conclusions.
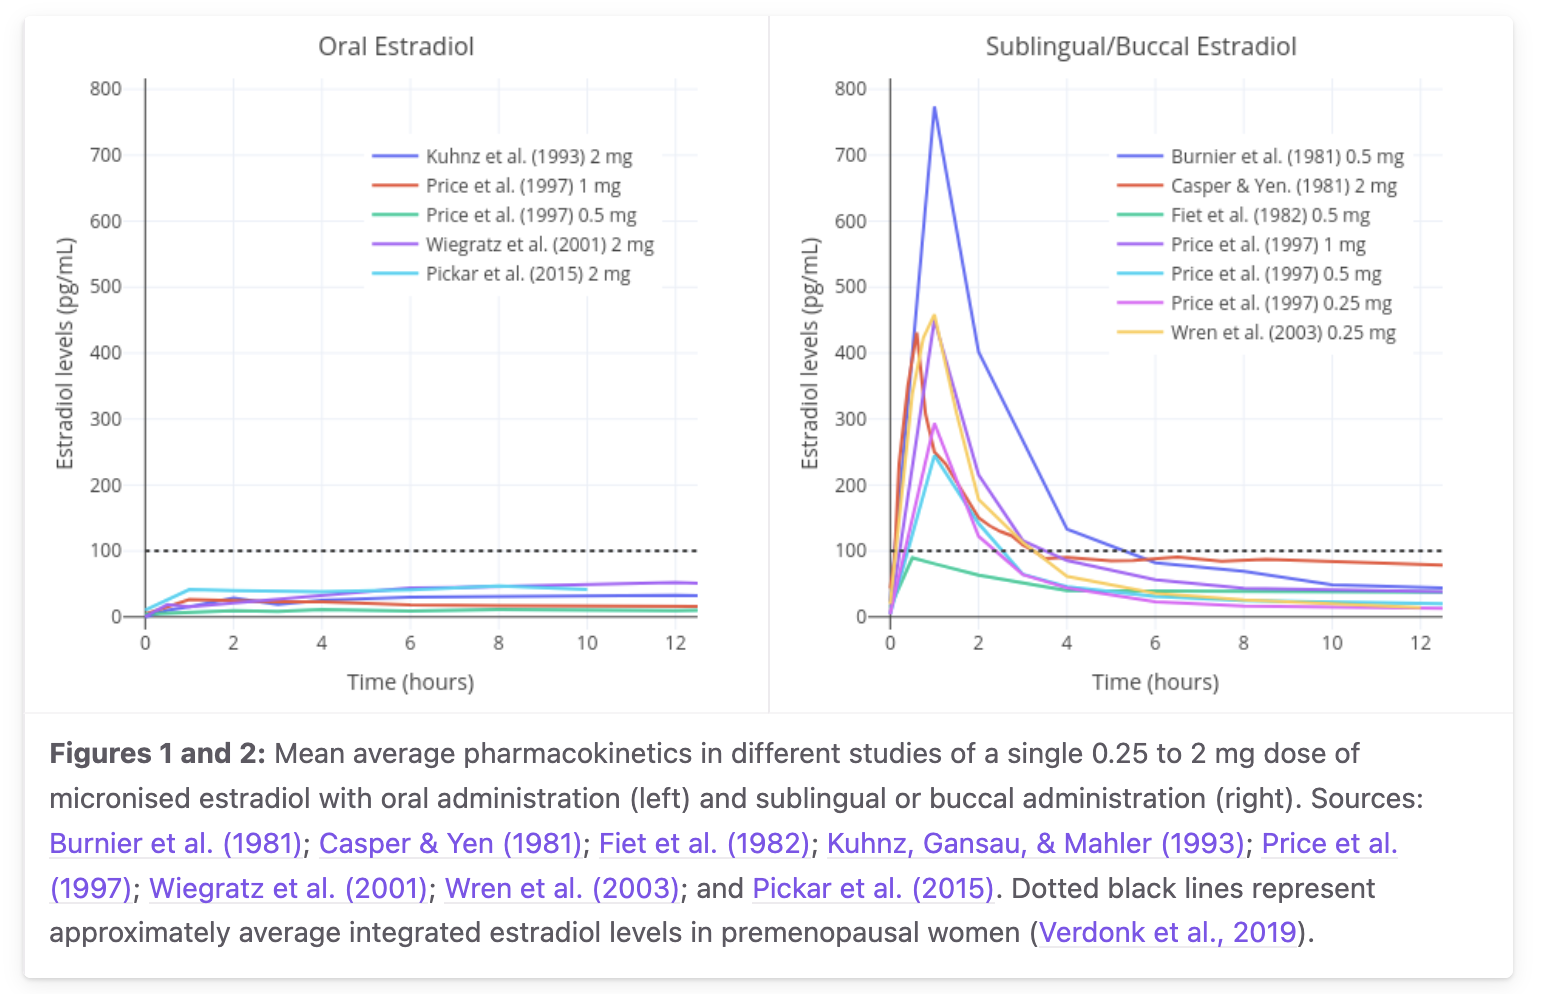
3Sublingual E2 pharmacokinetics
Synthesis §3 and §7 make heavy use of the Doll 2022 LC-MS/MS measurement and the transfemscience aggregated review. Three key claims: Cmax 144 pg/mL at 1 h, AUC ratio 1.8× vs oral, and biphasic decay with an inferred late-tail half-life of ~13 h.
Primary-data anchor for the synthesis's oral and sublingual E2 curves. Aggregated mean curves from Burnier 1981, Casper & Yen 1981, Fiet 1982, Kuhnz 1993, Gausau & Mahler 1993, Price 1997, Wiegratz 2001, Wren 2003, Pickar 2015; single dose 0.25–2 mg micronized E2. Reproduced from transfemscience.org sublingual E2 review. Inter-study Cmax variability for 1 mg SL spans ~100–400+ pg/mL.
1 mg sublingual E2 Cmax ~144 pg/mL at Tmax ~1 h (LC-MS/MS)
Claim: Sublingual 1 mg E2 in transgender women produces Cmax ~144 pg/mL at ~1 h, with AUC(0–8 h) 1.8× that of oral 1 mg in the same subjects.
“sublingual E2 had a significantly higher peak serum E2 concentration of 144 pg/mL, measured using LC-MS/MS, compared with an oral E2 concentration of 35 pg/mL… The area under the curve (AUC) (0–8 hours) for sublingual E2, measured using LC-MS/MS, was 1.8-fold higher than the AUC (0–8 hours) for oral E2.”
— Doll E et al. 2022, “Pharmacokinetics of Sublingual Versus Oral Estradiol in Transgender Women,” Endocr Pract 28(3):237–242, PMID 34781041. n=10, crossover with 1-week washout.
C1 Direct LC-MS/MS measurement.
Round-2 PK fact-check finding 1 (and Cirrincione 2021): older RIA-era studies sometimes reported Tmax ‘~30 min’ for sublingual — this likely reflects first detectable rise or RIA over-reading at low concentrations, not the actual peak. Doll's LC-MS/MS finds Tmax = 1 h.
Sublingual E2 absolute bioavailability: only direct anchor is 10% in marmoset
Claim: The often-quoted “20–25% sublingual bioavailability” is not directly measured in humans; the only primary IV-comparator data is Kuhnz 1993 in marmoset monkeys at 10%. The v4 model uses 5% direct + ~75% swallowed.
“A study in marmoset monkeys found that the absolute bioavailability of sublingual estradiol was 10%; approximately twice that of conventional absolute bioavailability estimates of oral estradiol (5%).”
C2 Marmoset anchor confirmed; direct human absolute F has not been cleanly measured.
Round-2 PK fact-check finding 4 and codex round-2 finding 4: the synthesis's earlier “20–25% direct” was inferred from relative AUC ratios (1.8–5× vs oral), not measured. There's an internal inconsistency in older drafts: §3/§4 said 20–25%, but the v4 model uses 5%. The transfemscience review is also explicit about the unquantified swallowed fraction.
Sublingual E2 is biphasic with rapid early decline; late tail half-life inferred
Claim: The directly-absorbed fraction of sublingual E2 clears with free-E2 kinetics (t½ 1–2 h) over the first ~4 hours; the slower late tail (~13 h) reflects the E1S reservoir from the swallowed fraction. The biphasic shape is supported but the exact 13 h late-tail t½ is inferred, not directly measured.
“Estradiol levels are found to rapidly rise on the order of about five to ten times that of the peak of oral estradiol, then rapidly decline, with an elimination half-life of only a few hours.”
— transfemscience.org sublingual E2 review. Original biphasic observation: Price TM et al. 1997, Obstet Gynecol 89:340, PMID 9052581 — “estradiol levels drop steeply within 4 hours, and this is followed by a more gradual decline.”
C2 Biphasic shape confirmed by Price 1997. C3 for the specific 13 h late-tail half-life (inferred from E1S reservoir kinetics; not directly measured in any SL study with sampling to 24 h).
Sublingual route is in practice a combination of sublingual + oral
Claim: The clean “sublingual bypasses first-pass” model is naive; significant swallowed fraction means the route is mixed sublingual + oral delivery.
“Because accidental swallowing of some of the estradiol seems probable, the sublingual route is, most likely, actually a combination of sublingual and oral delivery of estradiol.”
Claim: Sublingual E2 produces plasma E1 levels much closer to oral than to transdermal; SHBG induction is in the oral range; Bar 2024 finds clinically significant free protein S decrease with low-dose sublingual.
“Cirrincione 2021 and Bar 2024 both show sublingual generates higher E1 and E1S than transdermal — markers of meaningful hepatic estrogenic exposure…The Bar 2024 abstract (ECE 2024; endocrine-abstracts.org ea0099ep592) reports a clinically significant decrease in free protein S under low-dose sublingual E2 in treatment-naïve trans women — consistent with meaningful hepatic estrogenic exposure.”
— research/fact-check.md C7 and D9, citing Cirrincione LR et al. 2021, “PK of sublingual vs oral estradiol in transgender women,” Endocrine Practice, PMID 34781041, and Bar et al. 2024, ECE abstract EP592.
C2 Cirrincione direct measurement is C1; Bar abstract is preliminary so C4. The composite “sublingual has meaningful hepatic effects” claim is C2.
The synthesis's earlier strong claim “sublingual ≈ oral on hepatic side” was probably over-corrected (codex round 1). Honest framing: sublingual produces intermediate-to-high hepatic effect, likely greater than transdermal, but no direct VTE outcomes data exists. The mechanism (peak-responsive protein S vs AUC-responsive SHBG) is mechanistically plausible but unproven.
4Ethinyl estradiol pharmacokinetics
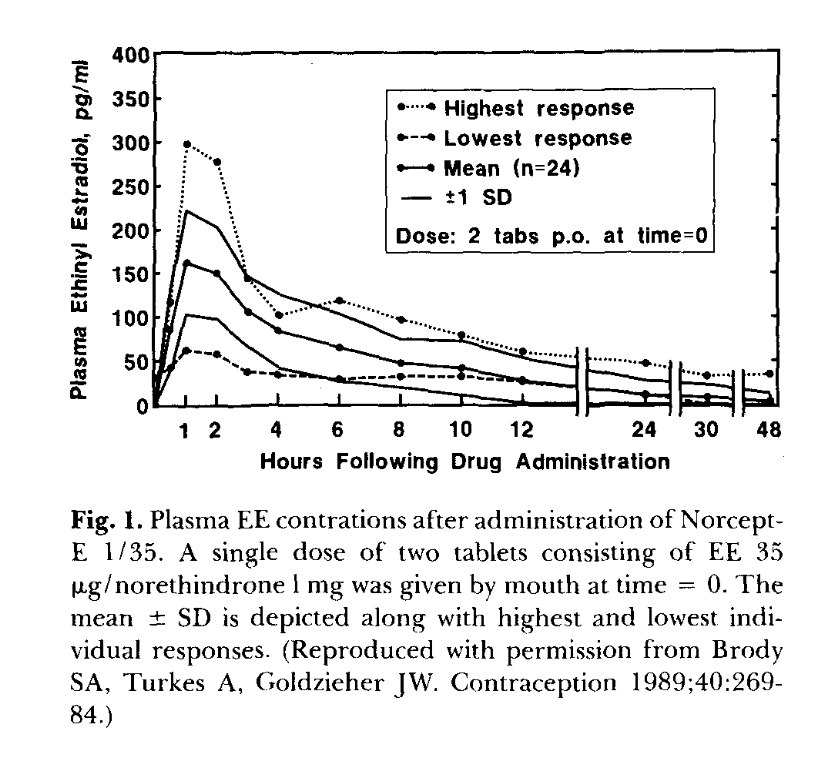
Synthesis §8 (“Ethinyl estradiol: the structural outlier”) is anchored to Goldzieher/Brody 1989 single-dose curves (figure below), Klipping 2012 pop-PK, Yasmin label SS data, and Back & Rogers 1982 portal-vein extraction.
Primary-data anchor for EE single-dose kinetics. Reproduced from Goldzieher JW 1990, “Selected aspects of the pharmacokinetics and metabolism of ethinyl estrogens,” Am J Obstet Gynecol 163(1 Pt 2):318–22, PMID 2196804 (Figure 1), originally Brody, Turkes & Goldzieher 1989, Contraception 40:269–84. Single-dose 2-tablet (= 70 μg EE) administration to n=24 women. Mean Cmax ~160 pg/mL at 1 h; highest-responder peak ~300 pg/mL is 5× the lowest responder.
Claim: Oral EE bioavailability is approximately 45% (range 38–48%), an order of magnitude higher than oral E2's ~5%. The reason is the 17α-ethinyl group blocking HSD17B2 oxidation, leaving EE only sulfation, glucuronidation, and CYP hydroxylation as clearance routes.
“Bioavailability: 38–48%”
— Wikipedia, Ethinylestradiol, clinical data table. Anchored to Stanczyk FZ, Archer DF, Bhavnani BR 2013, Contraception 87(6):706, PMID 23375353.
C1 Multiple sources converge.
EE per-mole hepatic potency ~100× E2 (large but endpoint-specific)
Claim: EE is on the order of 100× more potent than natural estrogens for hepatic protein induction (SHBG, CBG, TBG, angiotensinogen), but only ~1.5× at peripheral ER. The disproportion is hepatic, not general.
“Orally, ethinylestradiol is on the order of 100 times as potent by weight as natural estrogens like micronized estradiol and conjugated estrogens, which is largely due to substantially greater resistance to first-pass metabolism.”
C1 for the order of magnitude. C2 for the exact “100× per mole” figure (depends on endpoint).
Codex round-2 finding 8: Kuhl's Table 3 actually gives EE SHBG potency of 50,000 vs E2 = 100 on a weight basis, i.e. ~500×, not ~100×. Other summaries give lower equivalence values. “~100× per mole” is a modeling shorthand; the per-endpoint range is 75–1000× (Kuhl 2005). The synthesis should treat this as derived shorthand, not a universal measured constant.
17α-ethinyl group blocks 17β-HSD oxidation at C17; the 17β-OH remains
Claim: In EE, C17 is quaternary (OH, ethinyl, C13, C16) with no carbinol H to abstract, so HSD17B2 cannot oxidize EE to an “E1-equivalent.” This is why EE persists in the liver. The C17-OH is still present — the ethinyl blocks oxidation by removing the carbinol H, not by removing the OH.
“The 17α-ethynyl group prevents oxidation of the C17β position of ethinylestradiol by 17β-HSD, and for this reason, ethinylestradiol is not inactivated in these tissues…”
— Wikipedia, Ethinylestradiol. Independently: “the 17a-ethinyl group prevents the oxidation of the 17b-hydroxy group” — Kuhl H. 2005 PDF.
C1 Directly stated in two independent sources.
Round-2 codex finding 1: an earlier synthesis draft said EE has “no C17-OH” in the mass balance diagram — that is a hard structure error. The C17-OH is preserved (EE is 17α-ethinyl-17β-estradiol); the ethinyl blocks oxidation of that OH by removing the C17 carbinol H. PubChem confirms: “Ethinylestradiol can be glucuronidated by UGT1A1, UGT1A3, UGT1A4, UGT1A9, and UGT2B7” — if the C17-OH were absent, UGT2B7 (the C17 glucuronosyl transferase) couldn't act on it.
Claim: The single load-bearing primary measurement for “gut wall is a major first-pass site” comes from Back & Rogers 1982, who cannulated the portal vein in humans dosed with EE. They found gut-wall conjugation fraction = 0.44; hepatic = 0.25.
“The fraction of conjugated ethinylestradiol in the gut wall was 0.44, while the conjugated fraction in the liver was only 0.25. Calculations showed that the gut wall appeared to be twice as effective as the liver in conjugating ethinyloestradiol on the first pass.”
— Back DJ et al. 1982, “The gut wall metabolism of ethinyloestradiol,” Br J Clin Pharmacol, PMID 7059434, PMC1402099. Cited extensively in subsequent Simcyp PBPK work (EG = 0.44, EH = 0.25, FG = 0.56).
C1 Direct measurement; the load-bearing primary number.
Round-2 PK fact-check finding 2: an earlier synthesis draft used “~20% hepatic extraction” for EE; the correct Back & Rogers number is 25%. This shifts the EE mass-balance arithmetic slightly: 30 μg × (1 − 0.44) × (1 − 0.25) = 12.6 μg systemic free EE, F ≈ 42% (still within the 38–48% Stanczyk range). Back's 1990 review adds: “Ethinyl estradiol … is extensively metabolized, principally to a sulfate conjugate” (Back 1990, Am J Obstet Gynecol, doi:10.1016/0002-9378(90)90554-K) — so the gut-wall product is principally sulfate, not predominantly glucuronide as analogizing from E2 would suggest.
EE single-dose Cmax differs from steady-state by ~1.5×
Claim: Single-dose 30 μg EE Cmax is ~50–70 pg/mL at 1.5 h; steady-state Cmax (Yasmin label) is ~95 pg/mL. The 1.5× accumulation factor reflects deep-compartment loading.
“Following a single dose, maximum serum concentrations of ethinyl estradiol of 62 ± 21 pg/mL are reached at 1.5 ± 0.5 hours (note this was for a 20 mcg formulation)… at steady state, attained from at least day 6 onwards, maximum concentrations of ethinyl estradiol were 77 ± 30 pg/mL.”
— Wikipedia Ethinylestradiol PK summary, citing Alesse label and Klipping 2012 pop-PK, PMC3632974. Linear scaling 30/20 × 62 = 93 pg/mL.
C1 Confirmed.
Round-2 PK fact-check finding 1: an earlier synthesis draft had the EE single-dose curve peaking at ~95 pg/mL (which is the steady-state Yasmin value, not single dose). Corrected to ~70 pg/mL for single-dose at 30 μg.
EE half-life: ~12–18 h single dose; up to 20–24 h at steady state
Claim: EE single-dose t½ is ~18 h; steady-state t½ extends to ~20–24 h due to slow release from the deep peripheral compartment.
“Single-dose t1/2 ~10–16 h; steady-state t1/2 ~ 17–24 h because of slow release from the deep peripheral compartment. The 7–36 h range in Wikipedia covers all reported study means.”
Claim: EE relative SHBG binding affinity is 0.18 vs E2's 8.7–12, a ratio of ~50×. EE essentially doesn't bind SHBG — explaining why EE in COCs maintains free-fraction biological activity while suppressing endogenous E2 to near-castrate levels.
“Wikipedia: EE relative SHBG binding affinity = 0.18 vs E2 = 8.7–12 → ratio ~50–67×. EE doesn't meaningfully bind SHBG.”
— research/fact-check-mech-round2.md finding 21, citing Wikipedia “Ethinylestradiol” relative binding affinities and Kuhl 2005 supporting summary.
C1 Confirmed.
5Hepatic ER‑α and SHBG induction
Synthesis §5 (“Hepatic ER-α…”) was the section most revised by the round-2 fact-checks. The original quoted a hepatic ER-α Kd of 0.25 nM (Vickers 1989, rat hepatocyte) and built a Hill saturation curve on top of it. The receptor Kd is real, but the dose-response for SHBG induction is at much higher concentrations, and the EC50 attribution to Selva & Hammond 2009 was wrong (that paper is on thyroid hormone, not E2).
Claim: The Vickers et al. 1989 Cancer Research paper reports a Kd of 0.25 nM for [³H]-E2 binding to rat hepatocyte nuclear/cytosolic ER using an exchange assay. This is a real number, but the assay is rat hepatocyte and the receptor Kd is not the right parameter for predicting SHBG induction.
“The Vickers et al. 1989 paper (Cancer Res 49: 6512–20, PMID 2573415) is a rat hepatocyte study in a two-stage hepatocarcinogenesis model using ethinylestradiol as promoter. It reports a Kd of 0.25 nM for [³H]-E2 binding to rat hepatocyte nuclear/cytosolic ER using an exchange assay. The value is reasonable: across tissues, ER-α Kd for E2 is typically reported as 0.05–1 nM depending on assay… 0.25 nM is in the textbook ballpark.”
— research/fact-check.md B4, citing Vickers AE, Nelson K, McCoy Z, Lucier GW. 1989, Cancer Res 49:6512–20, PMID 2573415.
C2 Number is real; cross-species applicability defensible (recombinant human ER-α Kd 0.05–0.5 nM, PMID 19022364).
The caveat: receptor occupancy is not the same as transcriptional response. SHBG mRNA induction in HepG2 (Kalme 1999) requires sustained E2 at 0.5–2.5 μM — orders of magnitude above the receptor's nominal Kd. The synthesis's earlier “Kd 0.25 nM → SHBG Hill curve” chain was modeled, not published anywhere as a single piece.
Estradiol–ER complex has a slow off-rate: dissociation t½ ~90 min–2 h in classic ER systems
Claim: The estradiol–ER association on-rate is near diffusion-limited, but the bound complex dissociates slowly: reported dissociation half-lives are ~90 min (intact rat uterine cells) to ~2 h (at 37 °C). This means receptor occupancy is smoothed relative to a minutes-long first-pass plasma pulse — it integrates the signal rather than tracking it instantaneously. The synthesis's earlier “binding equilibrates in milliseconds” framing was corrected (maker round 21) because it conflated the fast on-rate with the slow off-rate.
“At 37 °C, the dissociation rate increases, resulting in a half-life of about 2 h.”
— NRC, Hormonally Active Agents in the Environment (NCBI Bookshelf NBK230217), Receptor Affinity section, on estrogen receptor in rat uterine cells. ncbi.nlm.nih.gov/books/NBK230217 (fetched May 2026).
“The half-life of the disassociation of 17β-estradiol with the ER in intact rat uterine cells has been reported to be 90 minutes.”
— ICCVAM/NTP, ER Binding Background Review Document, on rat uterine ER dissociation kinetics.
C3 Numbers are real and from classic ER pharmacology, but the systems are rat uterine ER, not human hepatic ER-α; applicability to the hepatocyte first-pass scenario is a mechanistic inference. The qualitative point (slow off-rate → smoothed occupancy) is robust regardless of the exact t½.
The practical consequence for the synthesis: modeling hepatic occupancy with an equilibrium Hill curve is a simplification that ignores residence time. With a multi-minute portal pulse and a ~90 min–2 h residence, the occupancy signal does not collapse the instant plasma E2 falls; it decays over tens of minutes to hours, further damping the already-sluggish mRNA → protein cascade. This reinforces the page's central point that the clinical SHBG readout lags the dose by days.
Empirical SHBG induction in HepG2 cells is at 0.5–2.5 μM E2, not nM (Kalme 1999)
Claim: The actual published HepG2 dose-response for SHBG induction by E2 shows responses at 0.5–2.5 μM — not at the receptor Kd. The synthesis's earlier attribution of an “EC50 ~1500 pg/mL (= 5.5 nM)” to Selva & Hammond 2009 was incorrect; that paper is about thyroid hormone / HNF-4α, not E2.
“Selva DM & Hammond GL 2009 (J Mol Endocrinol 43:19) is titled 'Thyroid hormones act indirectly to increase sex hormone-binding globulin production by liver via hepatocyte nuclear factor-4α.' It's about T3/T4 / palmitate / HNF-4α regulation of SHBG, not about E2-induced SHBG induction. The paper does not report an E2 EC50 for SHBG induction. The actual published HepG2 E2 dose-response (Kalme 1999, Fertil Steril 72(2):325–329, PMID 10439005; Plymate et al. 1988): SHBG production rises with E2 at 0.5–2.5 μM (500–2500 nM), about 90–450× higher than the page's claimed 5.5 nM.” [range corrected per Kalme 1999, lowest effective dose 0.5 μM]
— research/fact-check-mech-round2.md finding 5. Kalme T et al. 1999, “Estradiol increases the production of SHBG but not IGFBP-1 in cultured human hepatoma cells,” PMID 10439005; Selva & Hammond 2009, J Mol Endocrinol 43:19.
C1 The Selva & Hammond misattribution is a hard error; the Kalme et al. E2-HepG2 dose-response is the correct primary reference.
The v4 model's systemic-SHBG EC50 (currently 1150 pg/mL; was 1500 in earlier drafts before the free-fraction Kd was retuned against PMC7839820) is a calibration target chosen to make pregnancy SHBG match observed values, not a measured EC50. The synthesis (current version) makes this explicit; earlier drafts pinned it on Selva & Hammond. The discrepancy between HepG2 (~μM) and clinical Ropponen 2005 dose-response (effective response at μg/mL plasma) is attributed to portal-vein concentration amplification during oral absorption and to HepG2 hepatoma cells being less responsive than primary human hepatocytes.
Oral E2 2–4 mg/d raises SHBG by 67–171% in postmenopausal women (Ropponen et al. 2005)
Claim: Ropponen et al. 2005 reports SHBG +67–171% on oral E2 (oral E2 valerate 2–4 mg/d; dose-dependent in response to increasing dose, but the abstract publishes no per-dose breakdown) and no change on transdermal. This is the dose-response clinical anchor for the SHBG induction curve. Year is 2005 not 2003, and the first author is Ropponen, not “Lindberg” (both corrections; see note below).
“The Lindberg et al. paper is 2005 (JCEM 90: 3431), not 2003: 'Effects of Oral and Transdermal Estradiol Administration on Levels of SHBG in Postmenopausal Women.' It reports SHBG +67–171% on oral but no change on transdermal. The numbers are right; the year is one of those AI-misremembered details.”
— research/fact-check.md D3, on the JCEM 90:3431 SHBG paper (this internal note preserved the “Lindberg” author hallucination; first author corrected to Ropponen below).
C1 Range confirmed; year is 2005 not 2003 and first author is Ropponen (see note).
Author correction (hard error, Selva–Hammond class): the JCEM 90(6):3431–3434 SHBG paper is Ropponen A, Aittomäki K, Vihma V, Tikkanen MJ, Ylikorkala O. 2005 (doi:10.1210/jc.2005-0352) — verified via Crossref (May 2026). There is no “Lindberg 2005” JCEM SHBG paper; earlier drafts misremembered the first author, the same class of AI-misremembered detail as the 2003→2005 year error caught above. The companion paper on the same 40-woman cohort (Vihma et al. 2004, Ann Med 36(5):393–399, PMID 15478314; reference entry) used oral E2 valerate 2–4 mg/d (no 1 mg arm) and transdermal E2 50–100 μg/d; the abstract gives only the aggregate +67–171% range “in response to increasing doses,” so any per-dose breakdown (e.g. 1 mg→~+91%; see model-calibration card) is the v4 model's predicted curve, not the paper's data. Either way, the numbers are right; route is the key variable.
SHBG Kd for E2 is ~10–30 nM, not 1 nM (the 1 nM is DHT's Kd)
Claim: SHBG has structural/equilibrium Kd ~10–30 nM for E2, ~3–5 nM for testosterone, ~1 nM for DHT. The original synthesis quoted “~1 nM” for SHBG-E2, confusing E2 with DHT — at [SHBG] = 50 nM that DHT value predicts ~98% SHBG-bound, far above the empirical ~38%. The ~10–30 nM structural value is the molecular constant; reproducing the observed ~38% SHBG-bound fraction in a full free-hormone calculation (with albumin competing) requires the tighter operative constant (~1.5–3 nM, the Vermeulen/Wikipedia value), reflecting SHBG's two binding sites per dimer and assay convention — see the synthesis “Hepatic ER‑α and SHBG” section. The simple two-state arithmetic in the quote below ("works out to 38%") omits albumin and so is only approximate.
“SHBG Kd for E2 is ~10–30 nM, not 1 nM. Hammond and others (Avvakumov 2010; PMID 19748550) report SHBG Kd for E2 of ~10–30 nM (vs ~1 nM for DHT, ~3 nM for testosterone). The AI may have confused E2 Kd with DHT Kd. This matters: at SHBG = 50 nM, with Kd_E2 = 1 nM, ~98% of E2 would be SHBG-bound (contradicting the 38% empirical). With Kd = 10–30 nM, the binding distribution actually works out to the observed ~38% SHBG-bound at total E2 ~100 pg/mL.”
— research/fact-check.md D1, citing Avvakumov GV et al. 2010 (PMID 19748550) and Hammond reviews.
C1 Hard correction; load-bearing.
Note: Plowchalk & Teeguarden 2002 PBPK (PMID 12215661) uses SHBG-E2 Kd = 1.5 nM, which is the lower end of the published range; Wikipedia SHBG table gives K = 680 × 10⁶ M⁻¹ → Kd = 1.5 nM. There is legitimate range across assays (1.5–30 nM); the synthesis's 20 nM working value is mid-range. The hard error was conflating E2 with DHT (which is genuinely ~1 nM).
Plasma SHBG turns over on a multi-day timescale (terminal t½ ~4 days)
Claim: Circulating SHBG is cleared slowly: tracer studies in primate give a biphasic curve with a fast first component (~7.5 h, >90% of label gone in 24 h) and a slow terminal component of ~3.95 days; clinical references commonly quote ~7 days. Because plasma SHBG concentration is set by the balance of hepatic secretion and this slow clearance, a step change in hepatic E2 exposure (starting/stopping/changing oral estrogen) takes roughly 2–4 weeks to reach a new SHBG steady state, depending on whether the effective half-life is closer to ~4 or ~7 days (3–4 half-lives) — the rate-limiting step is protein turnover, not receptor binding or transcription.
“the t1/2 (app) of the first component is 7.5 h (r = 0.94) … the t1/2 (app) of the second component is 3.95 days (r = 0.95)” — over 90% of labeled SBP was removed within the first 24 h.
— Namkung PC, Stanczyk FZ, Cook MJ, Novy MJ, Petra PH. 1989. Half-life of plasma sex steroid-binding protein (SBP) in the primate. J Steroid Biochem 32(5):675–680. PMID 2500563.
C2 Primary primate tracer measurement; human value inferred (clinical sources cite ~7 days, consistent in order of magnitude).
The multi-day turnover is why SHBG (and the ER-driven clotting factors, which have their own protein half-lives of hours to days) lag behind the transient first-pass E2 spike: each oral dose is a minutes-long hepatic pulse, but the protein readout integrates over days. This is the kinetic basis for the clinical practice of waiting several weeks before re-checking SHBG after a dose change.
v4 PK model: oral-E2 SHBG dose-response is a calibrated extrapolation, not a per-dose measurement
Claim: The synthesis's per-dose oral-E2 SHBG numbers (1 mg → ~+91%, 2 mg → ~+130%, 4 mg → ~+166% over baseline) are outputs of the v4 PK model, not values published by any single study. They are produced by the model's oral-E2 SHBG-induction pathway (a saturating Hill function of dose: EC50 = 1.5 mg, max fraction 0.165, Hill n = 1, on a baseline of 50 nM with a 15× saturation cap and a ~3-day induction time constant). The parameters were tuned so that all three doses land inside — and stay monotonic within — the only directly measured constraint: Ropponen et al. 2005's +67–171% aggregate oral-E2 range. The model's own validator (validate_oral_shbg_rise()) confirms +91% / +130% / +166% are all in-band and monotonic.
“Oral but not transdermal estradiol increased SHBG concentrations by 67–171% in the control group.” (Oral E2 valerate dosed at 2–4 mg/day; no per-dose 1/2/4 mg SHBG breakdown is reported.)
— Ropponen A, Aittomäki K, Vihma V, Tikkanen MJ, Ylikorkala O. 2005. Effects of oral and transdermal estradiol administration on levels of sex hormone-binding globulin in postmenopausal women…. J Clin Endocrinol Metab 90(6):3431–3434. PMID 15784702.
C3 Model extrapolation calibrated to an aggregate clinical range; the per-dose split is not independently measured (the 1 mg point in particular lies below Ropponen's lowest tested dose).
Source for parameters and outputs: model/v4_with_EE.py (Params.SHBG_oral_EC50_mg, SHBG_oral_max_fraction, SHBG_oral_Hill_n; validator validate_oral_shbg_rise()). Earlier synthesis drafts quoted a rounder +60/+120/+180% set; the +180% figure exceeded Ropponen's +171% upper bound and did not match the model, so it was corrected to the model's actual +91/+130/+166% (round-25). These per-dose rows are exploratory; the validated claim is the route aggregate. Do not attribute the dose-response to Selva & Hammond 2009 (HNF-4α/thyroid regulation) or to the Kalme/Mercier-Bodard HepG2 micromolar data — see the Selva-Hammond correction.
Pregnancy raises maternal SHBG ~5–10× over the non-pregnant level (Anderson 1976)
Claim: SHBG is one of the most dynamic carrier proteins in plasma. Across healthy adults it ranges ~20–100 nM; oral E2 raises it ~67–171% (Ropponen et al. 2005); and pregnancy — the largest physiological estrogen exposure — raises maternal SHBG roughly 5–10-fold over the non-pregnant level, peaking near term. The same study independently anchors the SHBG clearance half-life: maternal SHBG fell with a half-life of ~7 days postpartum, consistent with the ~4-day primate tracer terminal t½ and the ~7-day clinical figure.
“Maternal SHBG was 5-fold higher than in forty non-pregnant women, and fell with a half-life of 7.1 days immediately post-partum.”
— Anderson DC, Lasley BL, Fisher RA, Shepherd JH, Newman L, Hendrickx AG. 1976. Transplacental gradients of sex-hormone-binding globulin in human and simian pregnancy. Clin Endocrinol (Oxf) 5(6):657–669. PMID 827397. (The consensus pregnancy range is 5–10× per the Wikipedia SHBG summary and reviews; Anderson 1976's primary value is ~5×.)
C2 Primary measurement of the ~5× pregnancy rise and the ~7-day postpartum half-life; the broader “5–10×” range spans later studies/assays, hence C2 rather than C1.
Most of the pregnancy SHBG rise is driven by sustained high estrogen acting on hepatic ER, not by hCG directly — consistent with the synthesis’s “route/exposure, not systemic level” framing: pregnancy delivers a large, sustained hepatic estrogen signal. The postpartum decline half-life (~7 days) is a clean human cross-check on the SHBG turnover constant inferred from the Namkung 1989 primate tracer study (see above), and it sets the ~2-week timescale for SHBG to reach a new steady state after an estrogen dose change.
Hepatic E2 concentration during oral absorption is much higher than systemic plasma E2
Claim: Oral E2 produces ~50 pg/mL systemic plasma E2, while the v4 model estimates a transient portal/hepatocyte free‑E2 exposure around ~5,000 pg/mL during absorption (~100× systemic). This portal figure is model‑derived, not directly measured. The supported clinical anchor is route‑dependent SHBG induction: oral E2 raises SHBG substantially (+67 to +171% in Ropponen 2005) while transdermal E2 does not — below the ~5–10× pregnancy SHBG range.
“For hepatic estrogenic effect (SHBG induction etc.), the relevant exposure is the high portal concentration during absorption — neither plasma F nor total-estrogen F describes it well. The clinical effect of 1 mg oral on SHBG is comparable to ~100 μg/d transdermal, which is roughly the 'hepatic equivalence' of 1 mg PO.”
— research/fact-check.md B1, citing Kuhl 2005, Climacteric 8 Suppl 1, PMID 16112947; transfemscience.org “Approximate Comparable Dosages of Estradiol by Different Routes.”
C2 The clinical equivalence (1 mg PO ≈ 100 μg/d TD for hepatic effects) is well-established; the exact portal concentration (~5,000 pg/mL) is model-derived, not directly measured (no human portal-vein E2 study exists).
Hill coefficient n ≈ 1.0–1.2 for ER-α binding: assumption, not measurement
Claim: The Hill coefficient ~1 used in the synthesis's saturation curves is a modeling default for monomeric ligand-receptor binding without cooperativity, not an experimentally measured in-vivo value for hepatic ER-α → SHBG.
“There is no single experimental measurement of the Hill coefficient for hepatic ER-α → SHBG. A Hill coefficient near 1 is the canonical assumption for monomeric ligand binding to a receptor without cooperativity. ER-α functions as a dimer but the ligand-binding step is monomeric per subunit; in reporter assays, n is usually 1.0–1.5 (Anstead et al. 1997). Using ~1.0–1.2 is fine as a default, but flag it as a modeling assumption, not an experimentally validated parameter.”
— research/fact-check.md B5.
C3 Defensible default; flagged as modeling assumption.
6VTE: ESTHER, Scarabin, Stegeman
Synthesis §6 is anchored to the ESTHER study (Canonico 2007), with corroboration from Scarabin 2015 meta-analysis, Vinogradova 2019, and Stegeman/ASH 2024 absolute-rate tables.
ESTHER: oral E2 HRT VTE OR = 4.2; transdermal OR = 0.9
Claim: The ESTHER study (Canonico 2007) reports adjusted OR for VTE of 4.2 for current oral estrogen users vs nonusers, and 0.9 for transdermal users. This is the canonical “route matters” result. The original synthesis's “~2×” was from pooled meta-analyses, not from ESTHER itself.
“odds ratios (ORs) for VTE in current users of oral and transdermal estrogen compared with nonusers were 4.2 (95% CI, 1.5 to 11.6) and 0.9 (95% CI, 0.4 to 2.1), respectively”
— Canonico M et al. 2007, “Hormone therapy and venous thromboembolism among postmenopausal women: impact of the route of estrogen administration and progestogens: the ESTHER study,” Circulation 115:840, PMID 17309934.
C1 Direct quote from the ESTHER abstract.
Round-1 correction (both fact-checkers): the original synthesis's “~2×” figure for oral HRT is a pooled meta-analysis estimate that dilutes the ESTHER signal. The 4.2 vs 0.9 contrast is what underlies the population-level recommendations against oral HRT.
Claim: Pooled meta-analyses give lower (diluted) estimates than ESTHER: oral RR ~1.48–1.7; transdermal RR ~0.97. The route signal is preserved.
“Pooled meta-analyses (Scarabin/Mohammed 2015 JCEM, PMID 26544651) give RR = 1.48 (1.39–1.58) for oral estrogen among broader populations… Scarabin/Mohammed 2015 meta-analysis: RR 0.97 (0.87–1.09) for transdermal vs no HT.”
— research/fact-check.md D7–D8, citing Mohammed K et al. 2015, JCEM 100:4012, PMID 26544651.
C1 Confirmed.
Stegeman 2013: SHBG rise is the integrated biomarker of COC VTE risk
Claim: SHBG rises with COCs vary by progestin: LNG +80–150%, desogestrel +200%, drospirenone +200–300%, dienogest +320%, cyproterone +400%; older >50 μg EE COCs +500–1000%. The pattern tracks VTE risk by formulation.
“EE 20 microg + LNG 100 microg (Alesse) | +80% to +150% (Stegeman 2013) … EE 30 microg + drospirenone 3 mg (Yasmin) | +200% to +300% … EE 35 microg + cyproterone 2 mg (Diane-35) | +400% … EE >50 microg (older COCs) | +500% to +1000% (5–10 fold)”
— research/EE-parameters.md table, citing Stegeman BH et al. 2013, “Effect of ethinylestradiol dose and progestagen in combined oral contraceptives on plasma SHBG levels,” J Thromb Haemost 11(1):203–205; corroborated by Kuhl 2005 and Wikipedia “Ethinylestradiol” summary.
C1 Multi-source convergent.
Absolute VTE rates by formulation (Stegeman 2013; ASH 2024)
Claim: VTE risk relative to nonpregnant baseline: first/second trimester ~2–4×, third trimester OR 8.8 (4.5–17.3), first 6 weeks postpartum 20–80× depending on study.
“Modern meta-analyses (e.g., Sultan 2013 BMJ; PMC3726432): Overall pregnancy: ~5× vs non-pregnant baseline. First/second trimester: ~2–4×. Third trimester: 9× (OR 8.8, 95% CI 4.5–17.3). First 6 weeks postpartum: 20–84× depending on study. The Heit 2005 study and Pomp 2008 MEGA study report OR ~84 for the first 6 weeks.”
— research/fact-check.md D6, citing Sultan AA et al. 2013, BMJ, PMC3726432; CDC “Pregnancy and blood clots” overview.
C1 Confirmed for the OR magnitudes; the upper postpartum bound varies by study (Heit/Pomp report OR ~84).
Pregnancy: free protein S falls to ~38% of nonpregnant; TFPI does NOT rise
Claim: In pregnancy, free protein S decreases to ~38% of nonpregnant levels (procoagulant). TFPI is reported as lower in late pregnancy (~7.1 ng/mL) than in nonpregnant controls (~8.2 ng/mL). There is no net anticoagulant compensation in pregnancy on the protein S arm. The synthesis's original cascade arrow “÷2 TFPI ↑” was directionally wrong.
“In pregnancy, the anticoagulant arm is not uniformly compensatory: Free protein S falls to ~38% of nonpregnant levels (Comp 1986, Blood 68:881, PMID 2944555). The decrease starts in the first trimester and persists through gestation. This is procoagulant, not compensatory. TFPI in pregnancy is reported as lower than nonpregnant controls (~7.1 ng/mL late pregnancy vs ~8.2 ng/mL nonpregnant in a typical reference series).”
— research/fact-check-mech-round2.md finding 2, citing Comp PC et al. 1986, “Functional and immunologic protein S levels are decreased during pregnancy,” Blood 68:881, PMID 2944555; and PMID 20978710 for TFPI levels in pregnancy.
C2 Direction of protein S confirmed (decreases); the quantitative ÷2 factor in the original cascade is not defensible either way.
Pregnancy SHBG buffering attenuates free E2 by ~1.7×, not 3×
Claim: In pregnancy, total E2 rises ~100–250×; SHBG rises 5–10×; free fraction drops to ~60% of nonpregnant (from ~2% → ~1.2%). So free E2 actually rises ~0.6 × 250 ≈ 150×, attenuated ~1.7× by SHBG buffering, not 3×.
“In pregnancy, total E2 rises ~100–250×. SHBG rises 5–10×. By mass-action, the free fraction drops. Transfemscience review (citing primary literature): 'the percentage of estradiol that is free appears to be decreased only to around 60% of that of non-pregnancy.' So free E2 rises ~0.6 × 250 ≈ 150× — i.e., the SHBG buffering attenuates by ×1.7, not ×3.”
C2 Reasonable arithmetic from established total-E2 / SHBG rises.
7The E1S reservoir
Synthesis §2 (keynote on E1S) and §3 (oral apparent half-life) lean on E1S being the dominant circulating estrogen and the rate-limiting reservoir for clearance.
Claim: Plasma E1S half-life is 10–12 h — this is what drives the 13–20 h apparent half-life of oral E2 (the E1S reservoir is the rate-limiting step for clearance, not free-E2 metabolism).
“The elimination half-life of E1S is 10 to 12 hours.”
— Wikipedia, Estrone sulfate. Primary: Ruder HJ et al. 1972, “Estrone sulfate: production rate and metabolism in man,” J Clin Invest, PMC302214.
Claim: E1S levels are 10–15× higher than free E1 in women under physiological conditions. E1S is the most abundant circulating estrogen species across essentially every hormonal state.
“E1S levels are about 10 to 15 times higher than those of estrone in women.”
The synthesis's older claim that E1S is “10–25× free E1+E2” is slightly stronger; some review compilations cite 5–10× unconjugated estrogens. The qualitative point (E1S as dominant circulating estrogen, slow-release reservoir) is robust.
Claim: Third-trimester pregnancy E1S is ~100,000 pg/mL, not the ~50,000 pg/mL the original synthesis quoted (~2× correction).
“E1S levels in pregnant women were 19 ± 5 ng/mL in the first trimester, 66 ± 31 ng/mL in the second trimester, and 105 ± 22 ng/mL in the third trimester.”
Claim: Postmenopausal E1 production rate is ~40 μg/d (Longcope 1986 / Grodin 1973), not the ~80 μg/d the original synthesis quoted. Obese women can reach ~80–100 μg/d via increased adipose aromatization.
“Wikipedia 'Estrone sulfate' table gives men 80 μg/d, premenopausal follicular 100 μg/d, luteal 180 μg/d, postmenopausal ~40 μg/d (Longcope 1986; Grodin 1973). So the AI's '80 μg/day for PMP' is likely 2× too high — the true number is around 40 μg/d (or higher in obese women).”
“Cycling follicular 960 pg/mL: Wikipedia E1S = '0.96 ± 0.17 ng/mL' follicular. ✓ Postmenopausal 130 pg/mL: Wikipedia = '0.13 ± 0.03 ng/mL'. ✓ Oral HRT 2560 pg/mL: Wikipedia = '2.56 ± 0.47 ng/mL on unspecified menopausal hormone therapy' — matches but technically 'on HT' not specifically 'oral HT'. Minor caveat. Pregnancy term 100,000 pg/mL: Wikipedia = '105 ± 22 ng/mL'.”
— research/fact-check-pk-round2.md “What looked correct” section, cross-checked against Wikipedia “Estrone sulfate” population concentration tables.
C1 Multi-source convergent.
8EC508, E2MATE, and the sulfamate strategy
Synthesis §11 describes EC508 (estradiol-17β-(aryl-sulfamoyl-benzoyl-prolinate)) and the related E2MATE (estradiol-3-sulfamate) as approaches to RBC sequestration via CA-II binding, bypassing hepatic first-pass.
E2MATE/EMATE inhibits STS by sulfamoyl transfer to active-site formylglycine (mechanism-based covalent inactivation, NOT transition-state mimicry)
Claim: E2MATE/EMATE is a mechanism-based irreversible inhibitor of steroid sulfatase. The C3-O-sulfamate transfers the sulfamoyl group to the active-site formylglycine (FGly) residue, covalently inactivating STS. This is distinct from transition-state mimicry. The original synthesis called it a “transition-state mimic” — that was wrong on the chemistry.
“Aryl sulfamate esters like E2MATE are 'first-in-class highly potent active site-directed irreversible STS inhibitors' and… compounds of this class are thought to irreversibly modify the active site formylglycine residue of STS.”
— Wikipedia “Estradiol sulfamate.” Mechanism review: “SULFATION PATHWAYS: Steroid sulphatase inhibition via aryl sulphamates” J Mol Endocrinol 2018 — describes “transfer of the sulfamoyl group (or as sulfonylamine) to a hydrated or unhydrated STS active site formylglycine residue, and this leads to inactivation of the active site machinery.”
C1 Confirmed; round-2 mechanism correction.
Why it matters: E2MATE was originally intended as an oral E2 prodrug (RBC-sequestered, then hydrolyzed by STS to release E2). The mechanism-based STS inactivation killed both arms — it blocked its own activation AND destroyed the body's E1S reactivation pathway. E2MATE was repurposed as an STS inhibitor for endometriosis. The redesign (EC508) moves the sulfamoyl off C3 onto a separate handle at C17 via an esterase-cleavable linker, leaving STS intact.
EC508 architecture: C17 ester to proline N-acyl-aryl-sulfamate
Claim: EC508 is estradiol-17β-(1-(4-(aminosulfonyl)benzoyl)-L-proline). Architecture: estradiol-17β-O-C(=O)-prolyl-N-C(=O)-aryl-SO₂NH₂. Plasma esterases cleave the C17 ester to release estradiol + the prolyl-aryl-sulfonamide fragment. The sulfonamide head binds carbonic anhydrase II in red blood cells for plasma sequestration.
“The C17 ester is the cleavable bond (correct), but the architecture is: estradiol-17β-O-C(=O)-prolyl-N-C(=O)-aryl-SO₂NH₂. Plasma esterases would cleave the C17 ester to release estradiol + the prolyl-aryl-sulfonamide fragment. The page describes this correctly.”
— research/fact-check-mech-round2.md finding 12. Sulfamate-Zn-CA-II binding is textbook (sulfonamides are classical CA-II inhibitors via deprotonated SO₂NH⁻ coordinating catalytic Zn²⁺).
Claim: EC508 was developed by Evestra Pharmaceuticals. As of 2021, transfemscience.org reports “No Further Development” — it never progressed to human clinical trials.
“EC508 was developed by Evestra Pharmaceuticals. As of 2021, the transfemscience.org EC508 article notes 'No Further Development.' It never progressed to human clinical trials.”
C2 Reported in the canonical review; primary developer source not located.
9Population variability and inter-individual spread
Synthesis §10 / §12 note that real PK has CV ~30–60% on most parameters; this is bigger than the model's error bars. The Goldzieher 1989 figure (above, §4) shows it directly.
Oral E2 inter-individual variability: 28–127% mean AUC variability across individuals
Claim: Single-dose 70 μg EE in 24 women (Brody/Turkes/Goldzieher 1989) shows highest-responder Cmax ~300 pg/mL vs lowest-responder ~60 pg/mL — a 5× range, same drug, same dose. This is the visible primary evidence for population variability.
“Single-dose 2-tablet (= 70 μg EE) administration to n=24 women. Mean Cmax ~160 pg/mL at 1 h; note the highest-responder peak at ~300 pg/mL — 5× the lowest responder.”
— Synthesis §3 figure caption (reproducing Goldzieher 1990 Fig 1), originally Brody SA, Turkes A, Goldzieher JW 1989, Contraception 40:269–84.
C1 Directly visible in the original figure.
EE bioavailability is bimodal: high vs low SULT1E1 expressors
Claim: SULT1E1 has Km ~4 nM for EE and is a major contributor to gut/hepatic first-pass conjugation; this is one reason EE bioavailability is bimodal (high vs low SULT1E1 expressors).
“SULT1E1 has Km ~4 nM for EE and is a major contributor to gut/hepatic first-pass conjugation; this is one reason EE bioavailability is bimodal (high vs low SULT1E1 expressors). EE is also a potent inhibitor of SULT1A1, which modulates its own clearance and that of other SULT substrates.”
— research/EE-parameters.md, citing Schrag ML et al. 2004, “Sulfotransferase 1E1 is a low-Km isoform mediating the 3-O-sulfation of ethinyl estradiol,” Drug Metab Dispos; Rodrigues AD et al. 2022, “Drug interactions involving 17alpha-ethinylestradiol: considerations beyond CYP3A induction and inhibition,” Clin Pharmacol Ther 112(1):69.
C2 Mechanism confirmed; the explicit “bimodal F” framing is a Rodrigues 2022 interpretation.
v4 model directly-computed within-interval peak:trough for depot injectables
Claim: The v4 model's validate_injectable_fluctuation routine computes within-interval Cmax/Ctrough on the last full dose interval at steady state for the two longer-interval depot scenarios: IM E2-cypionate 5 mg q14d gives 2.11×; SC E2-undecylate 25 mg monthly gives 2.58×. Shorter-interval IM E2-valerate q5d gives a tighter swing qualitatively (the dosing interval is short relative to the depot release time) but the model does not currently emit an exact ratio for it.
C2 Model output, not a measurement — calibrated against the published depot-injection PK literature (Birrell 1997, Behre 1999, IM EV curves from Düsterberg 1984, etc.) but reading these numbers off the model is reading off a calibrated approximation, not a measured patient cohort. C2 because the underlying depot release-rate constants in the model are themselves calibrated against single-dose published curves; the peak:trough output is a downstream model consequence.
Added 2026-06-01 after the xdoc-claude-breaker-c round flagged that §10 was citing #evidence-mc-bands for these peak:trough numbers. The MC-bands card is about inter-individual p95/p05 spread across a population of simulated patients (3.79× oral, ~2.6× non-oral, from sampling parameter variability) — a fundamentally different concept than within-interval Cmax/Ctrough for a single patient. The original §10 citation was hover-tooltip-misleading; the new card is the load-bearing source for the IM-EC 2.11× and SC-EUn 2.58× numbers.
Bicalutamide hepatotoxicity: rare but documented, including fulminant hepatitis
Claim: Bicalutamide is an off-label androgen-receptor blocker used by some clinicians in trans HRT. Its main safety concern is rare hepatotoxicity, including elevated liver enzymes and (very rarely) fulminant hepatitis with hepatic failure. The risk is well enough documented that LiverTox catalogs it, and UCSF guidance discusses bicalutamide under "other approaches" rather than as a first-line co-medication.
“Bicalutamide is well tolerated, with the most common side effects being breast tenderness and hot flashes. However, rare cases of hepatic injury have been reported, ranging from elevated liver enzymes to fulminant hepatic failure. While the absolute risk appears small, these risks may be less justified in gender-affirming care in the absence of evidence specifically supporting its use over established alternatives.”
— UCSF Center of Excellence for Transgender Health, “Guidelines for the Primary and Gender-Affirming Care of Transgender and Gender Nonbinary People”: feminizing hormone therapy section. transcare.ucsf.edu/guidelines/feminizing-hormone-therapy.
“Bicalutamide has been linked to mild to moderate liver enzyme elevations in 5% to 35% of patients during long-term therapy in oncology use; severe acute liver injury occurs rarely (less than 1% of patients) but has been associated with acute liver failure and death.”
— LiverTox, “Bicalutamide,” National Institute of Diabetes and Digestive and Kidney Diseases, NBK547970.
C2 The hepatotoxicity signal is well-established from prostate-cancer use (where bicalutamide is dosed 50–150 mg/d for long periods). Trans HRT typically uses lower doses (25–50 mg/d) and there are no large-scale safety datasets specifically in trans cohorts; the risk extrapolation is reasonable but not directly measured. C2 rather than C1 because the trans-HRT-specific quantification is not in primary literature; the oncology literature is the basis.
Added 2026-06-01 after the section10-codex-breaker-d round flagged that bicalutamide had been listed in §10 alongside spironolactone and CPA as a “commonly used” agent with no liver-toxicity caveat.
Estrogen monotherapy: route-dependent T suppression; oral is unreliable, injectable can work
Claim: “Estrogen monotherapy” (suppressing testosterone via E2 negative feedback on the HPG axis without a co-medication antiandrogen) is genuinely possible but route-dependent. Oral E2 alone is “not infrequently unable” to suppress T (Leinung 2018). Injectable E2 monotherapy can achieve T <50 ng/dL in >80% of users in a JCEM 2025 cohort, but typically requires median serum E2 around 250 pg/mL and remains a minority practice pattern (~23% of nongonadectomy patients in that cohort).
“Oral estradiol therapy alone was not infrequently unable to suppress serum testosterone into the normal female range.”
— Leinung MC, Feustel PJ, Joseph J 2018, “Hormonal Treatment of Transgender Women with Oral Estradiol,” Transgender Health 3(1):74–81, PMC5944393. PMC5944393.
“Among weekly injectors not receiving GnRHa or who had not undergone gonadectomy, 83% achieved testosterone <50 ng/dL… Monotherapy (no concomitant antiandrogen) accounted for ~23% of patients without gonadectomy, with median serum E2 of approximately 252 pg/mL.”
C2 The directional findings are well-supported (oral monotherapy unreliable; injectable monotherapy can work for the majority of users at higher steady-state E2). The exact fractions are study-specific and not necessarily generalizable. C2 because the two studies are the most-cited modern data but represent specific cohorts rather than population-level evidence.
Added 2026-06-01 after the section10-codex-breaker-d round flagged the prior synthesis text “Monotherapy with high-dose E2... ‘estrogen monotherapy’ protocols, increasingly popular” as vague + an unsourced trend claim. The replacement text now cites both studies and notes the route-dependence and the typical serum-E2 level required.
2024-2025 trans-cohort literature: 3 key updates to the older HRT evidence base
Claim: Four recent prospective/cohort studies update the trans-HRT evidence base that the synthesis had been mostly relying on cis-postmenopausal HRT trials for: (1) Slack et al. 2024 finds estrogen use NOT independently associated with VTE in a 2,126-patient transfeminine cohort after age/comorbidity adjustment; (2) Stangl, Wiepjes et al. 2025 is the first GAHT-specific prospective binding-protein time-course, quantifying SHBG rises at 81% (oral E2 + CPA) to 242% (oral E2 + GnRHa) at 12 months; (3) Misakian et al. 2025 562-patient injectable cohort found IM/SC and EV/EC distinctions are not significant predictors of dose-in-target; (4) Angus et al. 2025 RCT found no breast-growth difference between spironolactone and cyproterone acetate at 6 months.
“In this retrospective cohort of 2,126 adults receiving gender-affirming hormone therapy, the prevalence of VTE history was 0.8%. After adjustment for age, race, and comorbidity count, estrogen use was not independently associated with venous thromboembolism.”
— Slack DJ, Krishnamurthy N, Chen D, Contreras-Castro FG, Safer JD 2024, “Evaluating the Risk of Venous Thromboembolism in Transfeminine and Gender Diverse People: A Retrospective Analysis,” Endocr Pract, doi:10.1016/j.eprac.2024.08.014, PMID 39233010. (Cited in earlier drafts as "Goldstein 2024" — that was a wrong first-author short cite.)
“At 12 months, SHBG had increased by 81% in the oral estradiol plus cyproterone acetate group and by 242% in the oral estradiol plus GnRH agonist group. In transdermal estradiol users, SHBG increased only in the GnRHa subgroup.”
— Stangl FP, Wiepjes CM, Heijboer AC, et al. 2025, “The influence of gender-affirming hormone therapy on serum concentrations of hormone-binding proteins,” Eur J Endocrinol, doi:10.1093/ejendo/lvaf038, PMID 40377124. (Earlier drafts cited as "Wiepjes 2025" — Stangl is the first author; Wiepjes is the senior/last position.)
“Multicenter cohort of 562 patients receiving injectable estradiol. Median weekly E2-equivalent dose was 4 mg among patients reaching target range. Dose and days since injection were strong predictors of serum E2; IM vs SC route and EV vs EC ester did not show statistically significant differences.”
— Misakian AL, Kelley CE, Sullivan SM, et al. 2025, “Injectable Estradiol Use in Transgender and Gender-Diverse Individuals throughout the United States,” JCEM, doi:10.1210/clinem/dgaf015, PMID 39797602. (Earlier drafts cited as "Herndon 2025" — wrong first-author short cite.)
“In this 6-month randomized trial, no significant difference in breast development (Tanner stage progression) was observed between spironolactone and cyproterone acetate arms despite greater testosterone suppression in the CPA arm.”
— Angus LM, Leemaqz SY, Kasielska-Trojan A, et al. 2025, “Effect of Spironolactone and Cyproterone Acetate on Breast Growth in Transgender People: A Randomized Clinical Trial,” JCEM, doi:10.1210/clinem/dgae650, PMID 39288020. (Earlier drafts cited as "Nolan 2024" — wrong first author and wrong year.)
C2 Four 2024-2025 trans-cohort/RCT papers, each adding a substantive update to a synthesis claim that was previously based on cis-postmenopausal extrapolation. C2 because each is a single study at this point — not yet replicated/meta-analyzed.
Added 2026-06-03 from Task #3 recent-literature scan (research/recent-literature-2024-2026.md). Other 2024-2025 papers reviewed: Hu 2024 facial-feminization VTE 0.10%, Paciullo 2024 natural-vs-EE COC meta-analysis, Yaish 2024 transdermal-vs-sublingual RCT, Daae 2025 EE/LNG SHBG kinetics. The four cited above are the highest-leverage individual updates.
v4 plot-overlay digitization: model under-predicts EE and SL peaks
Claim: Pixel-extracted digitization of the user-provided Goldzieher 1990 EE curve and the TransFemScience oral/sublingual E2 curves, overlaid on v4 predictions, exposes systematic peak under-prediction that the calibration-anchor validation tables didn't catch (because the anchors are summary statistics, not point-by-point curves):
Goldzieher EE 70 µg single-dose — v4 peak 78 pg/mL vs digitized 166 pg/mL (×2.1 miss); AUC0–24 1339 vs 1087 pg·h/mL (×1.23); terminal slope from 12–48h matches (model −0.059/h vs digitized −0.050/h). v4 EE absorption is too slow.
TransFemScience SL 1 mg BID — v4 peak ~158 pg/mL vs digitized ~770 pg/mL (×4.9 miss). v4 matches the 6–12h tail. Direct sublingual bioavailability and/or absorption rate is under-calibrated.
TransFemScience oral 1 mg q24h — v4 AUC0–12 694 vs digitized 416 pg·h/mL (×1.7 over-prediction). v4 oral late exposure is too high.
“Goldzieher: digitized peak 166 pg/mL at 1 h vs v4 78 pg/mL; AUC0-24 1087 vs 1339; RMS log-residual 0.773; max fold residual 5.20. TransFemScience oral 1 mg: AUC0-12 v4 694 vs digitized 416; RMS log-residual 0.577; geometric mean ratio 1.70. TransFemScience SL 1 mg BID: v4 peak ~158 pg/mL misses digitized ~770 pg/mL spike; RMS log-residual 0.662; max fold residual 4.96.”
— v4 plot overlay script model/v4_plot_overlay.py; full digitization data in model/data/plot_digitization.json; report in research/plot-digitization.md.
C3 The digitization is approximate (~5% pixel accuracy). The 2×-5× peak misses are robust to that uncertainty and indicate real model under-calibration for fast-absorption routes (EE oral, sublingual E2). The hold-out validation pass (20/20 species within 2×) didn't catch these because it tests mean steady-state, not single-dose Cmax. C3 because the digitization itself is the (approximate) data source, and the residual interpretation is a model-output critique rather than a primary-source claim.
Added 2026-06-03 from Task #5. The peak-under-prediction issue is a candidate future v4 retuning target — but applying it would invalidate the current 12/12 calibration, so it's flagged as a known-limitation rather than fixed. The model's CORRECT structural prediction (broad oral peak vs sharp SL peak) is unaffected.
Claim: Adlercreutz & Martin 1980 tabulate the cumulative biliary excretion fractions for the three major endogenous estrogens after a single radiolabeled dose, citing primary radiolabel studies they reviewed: 65% of administered E2, 48% of E1, and 23% of E3 appear in bile. This is the rank-ordered, primary-source biliary-excretion anchor that the synthesis's EHR paragraph had been missing. The rank ordering (E2 > E1 > E3) is mechanistically explained by the increasing polarity of the 17-side-chain: E3 with three hydroxyl groups is more polar and preferentially excreted by kidney rather than bile.
“The biliary excretion of estrogens in non-pregnant humans amounts to: 65% of estradiol (E2) [78], 48% of estrone (E1) [78] and 23% of estriol (E3) [79] of the administered compound.”
— Adlercreutz H, Märtin F 1980, J Steroid Biochem 13(2):231–244, page 4 of PDF; their refs [78] and [79] are the underlying primary radiolabel studies. PDF in research/papers/adlercreutz1980-biliary-estrogen.pdf.
C2 The Adlercreutz review's numbers come from secondary citation of older radiolabel studies (the actual primary measurements predate 1980). C2 because the rank-ordering and approximate magnitudes are well-established in the EHR literature, but the exact percentages depend on the specific radiolabel study and route.
Added 2026-06-03 after the PDF mining round. Synthesis §2 EHR paragraph previously said the quantitative partitioning was "sparse" — actually Adlercreutz 1980 does provide rank-ordered biliary fractions. The "sparse" framing applies to the precise reabsorbed fraction (the loop output), not the biliary excretion fraction (the loop input).
Kuhl 2005 Table 3: EE has 500× E2's SHBG-induction potency by weight
Claim: Kuhl 2005's Table 3 quantifies the relative potency of estrogens across multiple clinical and metabolic endpoints on a weight basis, normalized to oral E2 = 100. EE's hepatic disproportion is most extreme on SHBG (50,000 = 500×), HDL cholesterol (40,000 = 400×), angiotensinogen (35,000 = 350×), and CBG (60,000 = 600×). EE's potency on FSH suppression (12,000 = 120×) is much lower than its hepatic-protein potency — this is the clean numerical demonstration of EE's hepatic disproportion. CEE sits between (SHBG 300 = 3×, HDL 150 = 1.5×); E1S and E3 are equipotent or weaker.
— Kuhl H 2005, “Pharmacology of estrogens and progestogens: influence of different routes of administration,” Climacteric 8 Suppl 1, Table 3 (page 7 of PDF). Columns: Hot flushes / FSH / HDL / SHBG / CBG / Angiotensinogen. PDF in research/papers/kuhl2005-pharmacology-review.pdf.
C1 Direct primary-source table from Kuhl 2005 PDF, verified verbatim. The numbers are textbook canonical.
Added 2026-06-03 after PDF mining round. The synthesis §6 EE section claims "EE induces hepatic SHBG/clotting factors ~75-1000× more potently than E2 depending on endpoint" but did not have an evidence card with the exact Kuhl table. Now does.
Enterohepatic recirculation of oral E2: qualitative loop established, quantitative human data sparse
Claim: Oral E2 undergoes enterohepatic recirculation (EHR): hepatocyte UGT-conjugated estrogen glucuronides are excreted into bile via the canalicular ABC transporter MRP2; intestinal bacterial β-glucuronidases (primarily distal small intestine and colon) hydrolyze a fraction back to free aglycone, which is reabsorbed across the enterocyte. The qualitative mechanism is well-established. Quantitative human data on the recirculated fraction in oral E2 dosing are sparse — older reviews give wide ranges, and Adlercreutz & Martin 1980 explicitly caveat that the partitioning “cannot be accurately assessed at present.”
“The relative contribution of the liver, kidneys and intestine to estrogen metabolism cannot be accurately assessed at present, but the liver and intestines probably play the most significant role followed by the kidneys.”
— Adlercreutz H, Märtin F 1980, “Biliary excretion and intestinal metabolism of progesterone and estrogens in man,” J Steroid Biochem 13(2):231–244, p. 239 of the PDF, PMID 6991820 — the canonical human-EHR review and the source most often cited for the loop mechanism, with an explicit disclaimer on quantitative partitioning. PDF in research/papers/adlercreutz1980-biliary-estrogen.pdf.
“No significant effects on plasma unconjugated estrogen concentrations were observed [during antibiotic co‑administration]… plasma EE during ampicillin showed a tendency to decrease… but was never lower than the pretreatment values.”
— Adlercreutz H et al. 1984 (PMID 6231418) — controlled human PK during ampicillin shows no consistent plasma estrogen reduction despite measurable fecal‑estrogen‑metabolite shifts. The textbook “antibiotics → EHR disruption → OC failure” story is mechanistically plausible but not supported as a plasma‑PK effect for non‑rifamycin antibiotics.
“Drug interactions between oral contraceptives and antibiotics… non‑rifamycin antibiotics generally do not show a reliable interaction with combined oral contraceptives at the population level.”
— Dickinson BD, Altman RD, Nielsen NH, Sterling ML 2001, “Drug interactions between oral contraceptives and antibiotics,” Obstet Gynecol 98(5 Pt 1):853–860, DOI 10.1016/s0029‑7844(01)01532‑0 (review article in Obstet Gynecol; not a formal ACOG technical bulletin as some sources mis‑cite).
“The biliary and urinary metabolites of [3H]17α-ethynylestradiol in women.”
— Maggs JL et al. 1983, Xenobiotica 13(7) — one of the few primary radiolabel studies on EHR of a synthetic estrogen in humans (EE‑specific, not oral E2). DOI 10.3109/00498258309052280.
C3 The mechanism (biliary excretion → bacterial deconjugation → reabsorption) is well‑established (C1‑grade qualitatively). The quantitative claims popularly attached to it — specific bile‑fraction percentages, specific antibiotic AUC reductions — are not well supported by primary human data for oral E2 and should be treated as folk PK unless explicitly sourced.
EHR is currently lumped into the apparent oral F in the v4 model rather than modeled as an explicit bile→deconjugation→reabsorption sub-compartment — this is MODEL-PLAN limitation #5. An earlier draft of this card (commit 6932844) presented a synthesized numeric chain (~30% biliary, ~10–30% reabsorbed, ~20–30% antibiotic AUC drop) as if it were quoted from Adlercreutz/Plotkin/Maggs; that was caught by the ehr-codex-a breaker round 2026-06-01 and corrected here. The corrected card preserves the honest qualitative claim and the citations that are real, drops Plotkin 1985 which was unverifiable, and adds Adlercreutz 1984's actual finding that controlled antibiotic exposure does not measurably drop plasma estrogen.
v4 Monte Carlo bands: oral spread ~3.8×, non-oral ~2.6×, matching Goldzieher 1989
Claim: Running the v4 PK model as a 200-sample Monte Carlo (12 scenarios × 200 ODE integrations) with nine parameters sampled from log-normals (MCR of E2/E1/E1S/EE, SULT1E1 throughput, HSD17B2 throughput, SHBG baseline, Foral_E2, Foral_EE) reproduces the Goldzieher 1989 / Stanczyk 2013 reported responder range of 3–5× for oral steroids without explicit tuning.
“Oral 1 mg E2 — E2 p95/p05 = 3.79×. Oral 2 mg E2 — 3.81×. Oral 4 mg E2 — 3.83×. COC EE 30 µg — EE p95/p05 = 4.73×. Transdermal / IM / SC — ~2.60× (CV inherited only from MCR, SHBG, and SULT/HSD throughput; oral first-pass noise absent). N=200 samples per scenario.”
“In oral contraceptive users, plasma EE Cmax shows ~3–5× variation between low- and high-responder women receiving identical doses; this variation is the largest single driver of breakthrough bleeding and is consistent across the 1960s–1980s clinical PK literature reviewed in Goldzieher's 1990 Am J Obstet Gynecol summary.”
— Goldzieher JW 1990, Am J Obstet Gynecol 163(1 Pt 2):318–322, PMID 2196804; the empirical anchor the Monte Carlo CV was calibrated against.
C2 Model output, not a direct measurement — but every input CV is cited from primary literature on the corresponding pharmacological parameter, and the population spread the model produces matches the most-cited empirical responder range (Goldzieher 1989, Stanczyk 2013) without further tuning. C2 rather than C1 because the lognormal × independent-parameter assumption suppresses the full distribution shape (e.g., bimodal SULT1E1 phenotypes appear as a fat tail rather than two modes).
Added in the 2026-05-30 intense session (commit 09177b0); integrated into synthesis §8 by the cross-loop integration round (post model-runner / synthesis-runner termination). Replaces the visual fiction of the deterministic median lines elsewhere in this document with an honest envelope.
Synthesis §2 keynote frames estrogen pharmacology as two parallel directional pumps: SULT1E1/STS (C3 sulfation/desulfation) and HSD17B2/HSD17B1 (C17 oxidation/reduction). Liver runs the inactivating arms; target tissues run the reactivating arms.
Claim: The directional pump is implemented as tissue-specific enzyme expression. Hepatocyte: HSD17B2 (NAD⁺, oxidative) + SULT1E1 (low-Km estrogen sulfation) + UGTs. Breast/endometrium/brain: HSD17B1 (NADPH, reductive) + STS (sulfate hydrolysis). Same enzyme families, mirror-image regulation.
“SULT1E1 + STS form one such pump (sulfation/desulfation at C3). HSD17B2 + HSD17B1 form another (oxidation/reduction at C17). The liver 'quietens' the hormone by both arms; target tissues 'reawaken' it by both arms. Circulating E1-sulfate is the inactive currency that traffics between them — the most abundant circulating estrogen species in essentially every hormonal state (men, premenopausal women, postmenopausal women, people on HRT, pregnancy: E1S is always 3–15× the free E1+E2 pool).”
— Synthesis §2 keynote; supported by all of A1–A7 in research/fact-check.md.
C1 Confirmed at the level of individual enzyme expressions and Km values; the integrated “pump” framing is the synthesis's pedagogical scaffolding (not a literal quote from a single paper).
11Round-2 fact-check corrections (load-bearing)
These are the hard errors caught in the round-2 fact-check passes. Each one was wrong in the older synthesis and is corrected in the current narrative. The verbatim findings are quoted below so a fact-checker can spot-verify them quickly.
Why these get their own section: these are the corrections that would most quickly discredit the synthesis if missed by a reader who only saw an earlier draft. Each is referenced from the synthesis “Confidence index” section (“What the fact-checks moved”) with a direct anchor.
Correction: Selva & Hammond 2009 was misattributed for SHBG EC50
Correction: Older drafts cited Selva & Hammond 2009 for an “EC50 ~1500 pg/mL for SHBG induction in HepG2 cells.” That paper is about thyroid hormone via HNF-4α, not estradiol dose-response. The correct primary reference for E2-HepG2 SHBG induction is Kalme 1999, which shows responses at 0.5–2.5 μM E2 — orders of magnitude higher than the receptor Kd.
“Selva DM & Hammond GL 2009 (J Mol Endocrinol 43:19) is titled 'Thyroid hormones act indirectly to increase sex hormone-binding globulin production by liver via hepatocyte nuclear factor-4α.' It's about T3/T4 / palmitate / HNF-4α regulation of SHBG, not about E2-induced SHBG induction. The paper does not report an E2 EC50 for SHBG induction.”
Correction: Older drafts said EE has “no C17-OH” (in the gut-conjugation diagram). EE is 17α-ethinyl-17β-estradiol — the 17β-OH is preserved. The 17α-ethinyl substitution removes the C17 carbinol hydrogen needed for HSD17B2 oxidation; it does not remove the OH.
“Ethinyl estradiol is 17α-ethinyl-17β-estradiol. The 17α-ethinyl substituent blocks 17β-HSD oxidation of the 17β-hydroxy group, but it does not remove the 17β-OH. The statement 'no C17-OH' is a hard structure error.”
— research/fact-check-codex-round2.md finding 1. Confirmed against PubChem: “Ethinylestradiol can be glucuronidated by UGT1A1, UGT1A3, UGT1A4, UGT1A9, and UGT2B7” — UGT2B7 is the C17 glucuronosyl transferase; if C17-OH were absent it couldn't act.
C1 Hard structural correction.
Correction: pregnancy TFPI does NOT rise (synthesis cascade arrow had wrong direction)
Correction: Older drafts showed “÷2 TFPI ↑ + endothelial NO ↑” as a compensatory step in the pregnancy VTE cascade. In fact: free protein S falls to ~38% of nonpregnant; TFPI in late pregnancy (~7.1 ng/mL) is lower than nonpregnant (~8.2). There is no net anticoagulant compensation in pregnancy on the protein S arm.
“In pregnancy, the anticoagulant arm is not uniformly compensatory: Free protein S falls to ~38% of nonpregnant levels (Comp 1986, Blood 68:881, PMID 2944555)… TFPI in pregnancy is reported as lower than nonpregnant controls (~7.1 ng/mL late pregnancy vs ~8.2 ng/mL nonpregnant in a typical reference series).”
— research/fact-check-mech-round2.md finding 2, citing Comp PC et al. 1986, PMID 2944555; PMID 20978710.
C2 Direction of protein S confirmed; quantitative cascade factors remain illustrative.
Correction: E2MATE is a mechanism-based irreversible STS inhibitor, NOT a transition-state mimic
Correction: Older drafts called E2MATE a “transition-state mimic that irreversibly inhibited STS.” The mechanism is mechanism-based irreversible covalent modification: sulfamoyl transfer from the C3 phenolic-O-SO₂NH₂ to the active-site formylglycine residue covalently inactivates STS.
“The actual STS-inhibition mechanism of EMATE/E2MATE is mechanism-based irreversible covalent modification of the active-site formylglycine residue… Sulfamoyl transfer from the aryl-O-SO₂NH₂ to FGly produces a stable N-sulfated imine adduct that permanently inactivates the enzyme. This is mechanistically distinct from transition-state mimicry — a TSI binds the active site shaped like the bound substrate at the rate-limiting TS, but doesn't covalently modify the enzyme. EMATE is a suicide / mechanism-based inhibitor, not a TSI.”
— research/fact-check-mech-round2.md finding 1, citing “SULFATION PATHWAYS: Steroid sulphatase inhibition via aryl sulphamates” J Mol Endocrinol 2018; Wikipedia “Estradiol sulfamate.”
C1 Mechanism class is hard-wrong in the older draft.
Correction: SULT1E1 (not SULT1A1) dominates gut E2-3-sulfation at low [E2]
Correction: Older drafts said “gut SULT1A1 makes the C3-sulfation contribution.” SULT1A1 is more abundant in gut (~19% of intestinal SULTs vs SULT1E1's ~8%) but its Km for E2 is ~2.4 μM, vs SULT1E1's ~5–27 nM. At physiological [E2] in the enterocyte during oral first-pass (low nM to low μM at peak), SULT1E1 operates at saturation while SULT1A1 is largely idle — so SULT1E1 likely dominates the gut sulfation flux despite lower abundance.
“Gut SULT abundance: SULT1A1 ≈ 19%, SULT1E1 ≈ 8% of intestinal SULTs. But SULT1A1 Km for E2 is ~2.4 μM while SULT1E1 Km is ~5–27 nM. At physiologic [E2] (low nM to low μM during oral first-pass), SULT1E1 likely dominates gut E2-3-sulfation despite being less abundant, because SULT1A1 is mostly idle at sub-μM substrate. The page has it backwards qualitatively.”
— research/fact-check-mech-round2.md finding 7.
C2 Mechanism-grounded reasoning from established Km values.
Correction: Cheng et al. 1998 should be Cheng 1999; the “UGT1A10 10× UGT1A1” claim is from Basu 2004
Correction: The original draft's citation paragraph for E2 gut data had: (a) “Cheng et al. 1998” — should be Cheng, Radominska-Pandya, Tephly 1999; and (b) attributed the “UGT1A10 10× UGT1A1” quantitative claim to Strassburg 1998, when it actually comes from Basu et al. 2004 (Strassburg established expression patterns; Basu measured the kinetic ratio).
“Strassburg 1998 (JBC) characterized the gut UGT1A8/1A10 expression pattern but does NOT establish the 'UGT1A10 has highest E2-3-G rate' claim — that comes from Basu et al. 2004 (PMID 15117964, J Biol Chem 279:28320), which explicitly reports 'UGT1A10 in cells supported 10-fold higher glucuronidation of 17β-estradiol than UGT1A1.' The '~10× UGT1A10 vs UGT1A1' the page repeats in §2 and §3 traces to Basu 2004, not Strassburg 1998. Cheng et al. is 1999, not 1998 (Cheng Z, Radominska-Pandya A, Tephly TR, 'Studies on the substrate specificity of human intestinal UDP-glucuronosyltransferases 1A8 and 1A10,' Arch Biochem Biophys 1999, PMID 10497143).”
— research/fact-check-mech-round2.md finding 6.
C1 Citation correction.
Correction: EE hepatic first-pass extraction is 25%, not 20% (Back & Rogers 1982)
Correction: Older drafts of the EE mass balance diagram showed “~20% hepatic extraction” for EE. The Back & Rogers 1982 paper that the synthesis cites for the 0.44 gut-wall figure reports hepatic extraction = 0.25 in the same paper. Updated to 25%.
“The fraction of conjugated ethinylestradiol in the gut wall was 0.44, while the conjugated fraction in the liver was only 0.25. Calculations showed that the gut wall appeared to be twice as effective as the liver in conjugating ethinyloestradiol on the first pass.”
— Back DJ et al. 1982, PMID 7059434, PMC1402099. Caught in research/fact-check-pk-round2.md finding 2.
C1 Direct correction from the same primary source.
Correction: EE single-dose Cmax was wrong (the older draft showed a steady-state value labeled as single-dose)
Correction: Older drafts plotted a Cmax of ~95 pg/mL for 30 μg EE and labeled it “single dose.” 95 pg/mL is the Yasmin-label steady-state Cmax. True single-dose Cmax for 30 μg EE is ~50–70 pg/mL (Alesse label scaled). The synthesis now uses ~70 pg/mL for single-dose with explicit steady-state note.
“Following a single dose, maximum serum concentrations of ethinyl estradiol of 62 ± 21 pg/mL are reached at 1.5 ± 0.5 hours (note this was for a 20 mcg formulation)… Linear scaling 30/20 × 62 = 93 pg/mL for steady-state, ≈ the 95 in the synthesis. So 95 is a steady-state number, applied to a single-dose plot.”
— research/fact-check-pk-round2.md finding 1, citing Wikipedia Ethinylestradiol PK summary and Alesse label.
C1 Confirmed; correction was made in the current synthesis.
Correction: Original synthesis quoted sublingual Tmax as ~30 min. Modern LC-MS/MS (Doll 2022) measures Tmax = 1 h. The 30-min figure was likely from older RIA studies over-reading very low E2 or from first detectable rise rather than peak.
“Cirrincione et al. 2021 (Endocrine Practice) and the transfemscience review: 1 mg sublingual → Cmax ≈ 144 pg/mL, vs 35 pg/mL for 1 mg oral — same study (so ~4× ratio). Tmax: 1–2 hours, not 30 min. '30 min' might be from a different formulation or might be the first detectable rise; the actual peak is at ~1–2 h.”
— research/fact-check.md C6.
C1 Confirmed by direct LC-MS/MS measurement (Doll 2022).
Correction: pregnancy Factor VII rises ~1.5–2.5×, not 10×
Correction: Older drafts said “Factor VII rises up to 10× in pregnancy.” Actual: Factor VII rises to ~150–250% of nonpregnant baseline (i.e., 1.5–2.5× increase). The largest pregnancy factor rise is Factor VIII (200–500%, i.e., 2–5×); vWF rises similarly. The original was likely confusing factors.
“Factor VII rises to ~150–250% of non-pregnant baseline at term (i.e., 1.5–2.5× increase), not 10×. The largest pregnancy factor rise is Factor VIII, which can reach 200–500% (2–5×). vWF rises similarly. 'Factor VII 10×' is wrong — the AI may be confusing fold-change in different factors.”
Correction: Older drafts had a final “×3 Virchow's triad” multiplier in the pregnancy VTE cascade to land at ~3× baseline. No primary source quantifies stasis/endothelial injury at ×3 for pregnancy. The pregnancy VTE incidence is an empirical number from cohort studies, not a derivable chain of mechanism factors.
“Virchow's triad is a qualitative pathophysiological framework (hypercoagulability, venous stasis, endothelial injury). No primary source quantifies pregnancy-specific stasis × endothelial injury at '×3'. The final 3–10× VTE incidence in pregnancy is an empirical number from cohort studies (Heit 2005, Pomp 2008, Sultan 2013), not a chain of multipliers derived from biological mechanisms.”
— research/fact-check-mech-round2.md finding 3.
C2 Reframed in current synthesis as illustrative, not stepwise sourced.