model/data/catechol_summary.json.C3Reference synthesis · inline C1–C5 confidence tags · cross‑linked to evidence and reference.
Estradiol (E2) pharmacology is governed by two reactive positions on the steroid skeleton — the aromatic C3 phenol (substrate for SULT1E1, UGTs, STS) and the saturated C17 secondary alcohol (substrate for the 17β-HSDs, UGT2B7, and C17 acyl esters). Liver and gut express the oxidative and sulfating arms (HSD17B2, SULT1E1) and inactivate E2 on absorption; target tissues express the reductive and desulfating arms (HSD17B1, STS) and reactivate it.C1 Circulating estrone-3-sulfate (E1S) is the inactive interconnecting reservoir, present at 5–15× the free E1+E2 pool in every hormonal state.C1
Route, not dose, determines the hepatic exposure that drives clinical effects. Oral 1 mg micronized E2 delivers only ~4–5% of the parent drug to systemic plasmaC1 but transiently floods hepatocytes to ~5,000 pg/mL during portal first‑passC3 (the 5,000 pg/mL portal-bolus number is model-derived — the route-equivalence rule itself is C2) — driving the modeled SHBG and clotting‑factor induction curve high (~81% of modeled maximum). Transdermal, IM‑ester, and SC‑ester routes deliver the same systemic E2 without the portal bolus and produce minimal hepatic effect. The ESTHER case‑control study (Canonico 2007) reports adjusted VTE odds ratios of 4.2 for current oral estrogen and ~1 (0.9) for transdermalC1 — i.e., transdermal carries no measurable VTE elevation while oral roughly quadruples it. This is the load‑bearing route‑vs‑dose contrast.
Hepatic ER‑α binds E2 at a sub‑nanomolar Kd (~0.25 nM ≡ ~68 pg/mL free, Vickers 1989, rat hepatocyte)C2, but the SHBG‑mRNA induction curve is much shallower and shifted to higher concentrations. Published HepG2 dose‑response (Kalme 1999) sees E2 effects at 0.5–2.5 µM.C1 The v4 PK model uses an EC50 of ~1150 pg/mL hepatic free E2 as a calibration target (NOT a measured value, and NOT from Selva & Hammond — that earlier citation was a misattribution).C3 Receptor occupancy and protein induction are two different curves; conflating them was the most important earlier framing error.
Ethinyl estradiol (EE) is the structural outlier. Its 17α‑ethinyl substituent makes C17 quaternary — the 17β‑OH is still present, but no carbinol hydrogen remains for HSD17B2 to abstract.C1 EE therefore escapes the dominant E2 inactivation pathway, reaches ~45% oral bioavailability, persists in the hepatocyte across many circuits, and induces hepatic SHBG/clotting factors ~75–1000× more potently per weight than E2 depending on endpoint (Kuhl 2005 Table 3: SHBG 500×, CBG 600×, HDL 400×, angiotensinogen 350× on a weight basis vs E2 = 100; vs FSH-suppression potency only 120× — the numerical signature of hepatic disproportion).C1 This is the mechanistic reason EE is contraindicated in modern E2‑based HRT and is being progressively displaced even in combined oral contraceptives. Rational prodrug strategies (EC508) attempt to deliver E2 orally while sequestering it from hepatic first‑pass; none has reached late‑stage trials.
17β‑estradiol (C18H24O2, MW 272.4) is a four‑ring steroid (A, B, C, D) with two metabolically reactive hydroxyls. The C3 hydroxyl is a phenol on the aromatic A ring (pKa ~10.7, so essentially fully protonated and uncharged at physiologic pH; log P ~4.0, high passive permeability).C1 The C17 hydroxyl is a 17β‑configured aliphatic secondary alcohol on the saturated D ring — chemistry that admits oxidation to the C17 ketone (E1) by removing the carbinol hydrogen.
17β‑estradiol with the two reactive hydroxyls highlighted. The phenolic A‑ring C3‑OH and the aliphatic D‑ring C17‑OH have completely different chemistries, which is why the enzymes that act on each position form non‑overlapping families.
| Family | Position | Reaction | Key isoforms & tissues |
|---|---|---|---|
| 17β‑HSDs | C17 | E2 ↔ E1 (oxidoreduction) | HSD17B1 reductive (NADPH; ovary, placenta, breast);C1 HSD17B2 oxidative (NAD⁺; liver, gut, endometrium)C1 |
| SULTs | C3 | Sulfation → E1S / E2‑3‑S | SULT1E1 Km ~5–20 nM for E2C1 — the lowest Km among human SULTs for estrogens (the “lowest for any substrate” phrasing in earlier drafts overreaches).C2 SULT1A1 Km ~2.4 µM. |
| UGTs | C3 / C17 | Glucuronidation → biliary | UGT1A1, 1A3, 1A8, 1A10 at C3;C1 UGT2B7 at C17 of E2. UGT1A10 (gut) is ~10× more active on E2 than hepatic UGT1A1 (Basu 2004).C1 |
| STS | C3 | E1S → E1 (reactivation) | Single isoform; breast, endometrium, brain, placenta, liver. Catalysis via an active‑site formylglycine residue.C1 |
| CYPs | C2, C4, C16α | Hydroxylation → catechols, E3 | CYP1A2, 1B1, 3A4. Minor (~5% of dose). |
The HSD17B1/HSD17B2 pair and the SULT1E1/STS pair each form a tissue‑directional pump. Liver and gut express the “off” arms (HSD17B2 with NAD⁺; SULT1E1) and inactivate E2 on absorption. Ovary, breast, brain, endometrium, and bone express the “on” arms (HSD17B1 with NADPH; STS) and reactivate E1S and E1 to E2. The cytoplasmic cofactor pools enforce this directionality — fed‑state hepatocyte [NAD⁺]/[NADH] ~700 (Williamson 1967) drives oxidation; cytoplasmic [NADPH]/[NADP⁺] ~100 in target tissues drives reduction.C1 Plasma E1/E2 ~5 at oral steady state is the empirical readout of this hepatocyte equilibrium (the thermodynamic calculation predicting an intracellular ratio of ~11 has correct arithmetic but fragile cofactor inputs, so the observed plasma ratio is the load‑bearing anchor).C3
Of an oral 1 mg dose, ~98% is absorbed across the enterocyte (high passive permeability). Gut‑wall conjugation by UGT1A10 removes an inferred ~30–50% of absorbed E2 before portal entry.C3 Of the residual that reaches the liver, ~90% is extracted on first pass (HSD17B2 oxidation to E1, SULT1E1 sulfation to E1S, UGT glucuronidation with biliary export via MRP2). Only ~40 µg (~4% of dose) exits the liver as free E2 — the canonical “Foral ≈ 5%” figure.C1 The v4 PK model partitions the remaining ~96% into ~30% E1, ~32% E1S, ~29% glucuronides, and ~5% catechols/E3/methylated metabolites; these fractions are model calibration outputs, not measured human radiolabel data (no portal‑vein cannulation study has been done on E2 the way Back & Rogers 1982 did for EE).C3 Kuhl 2005's textbook fractions (~15% E1, ~25% E1S, ~50% glucuronides) are looser anchors of the same shape.C2
The qualitative load‑bearing point: only a few percent of an oral E2 dose becomes free plasma E2; most becomes circulating E1 and E1S that target tissues reactivate over the following 12–24 h. The “5% bioavailability” figure understates total estrogenic activity over time, and overstates the dose actually presented to peripheral receptors.
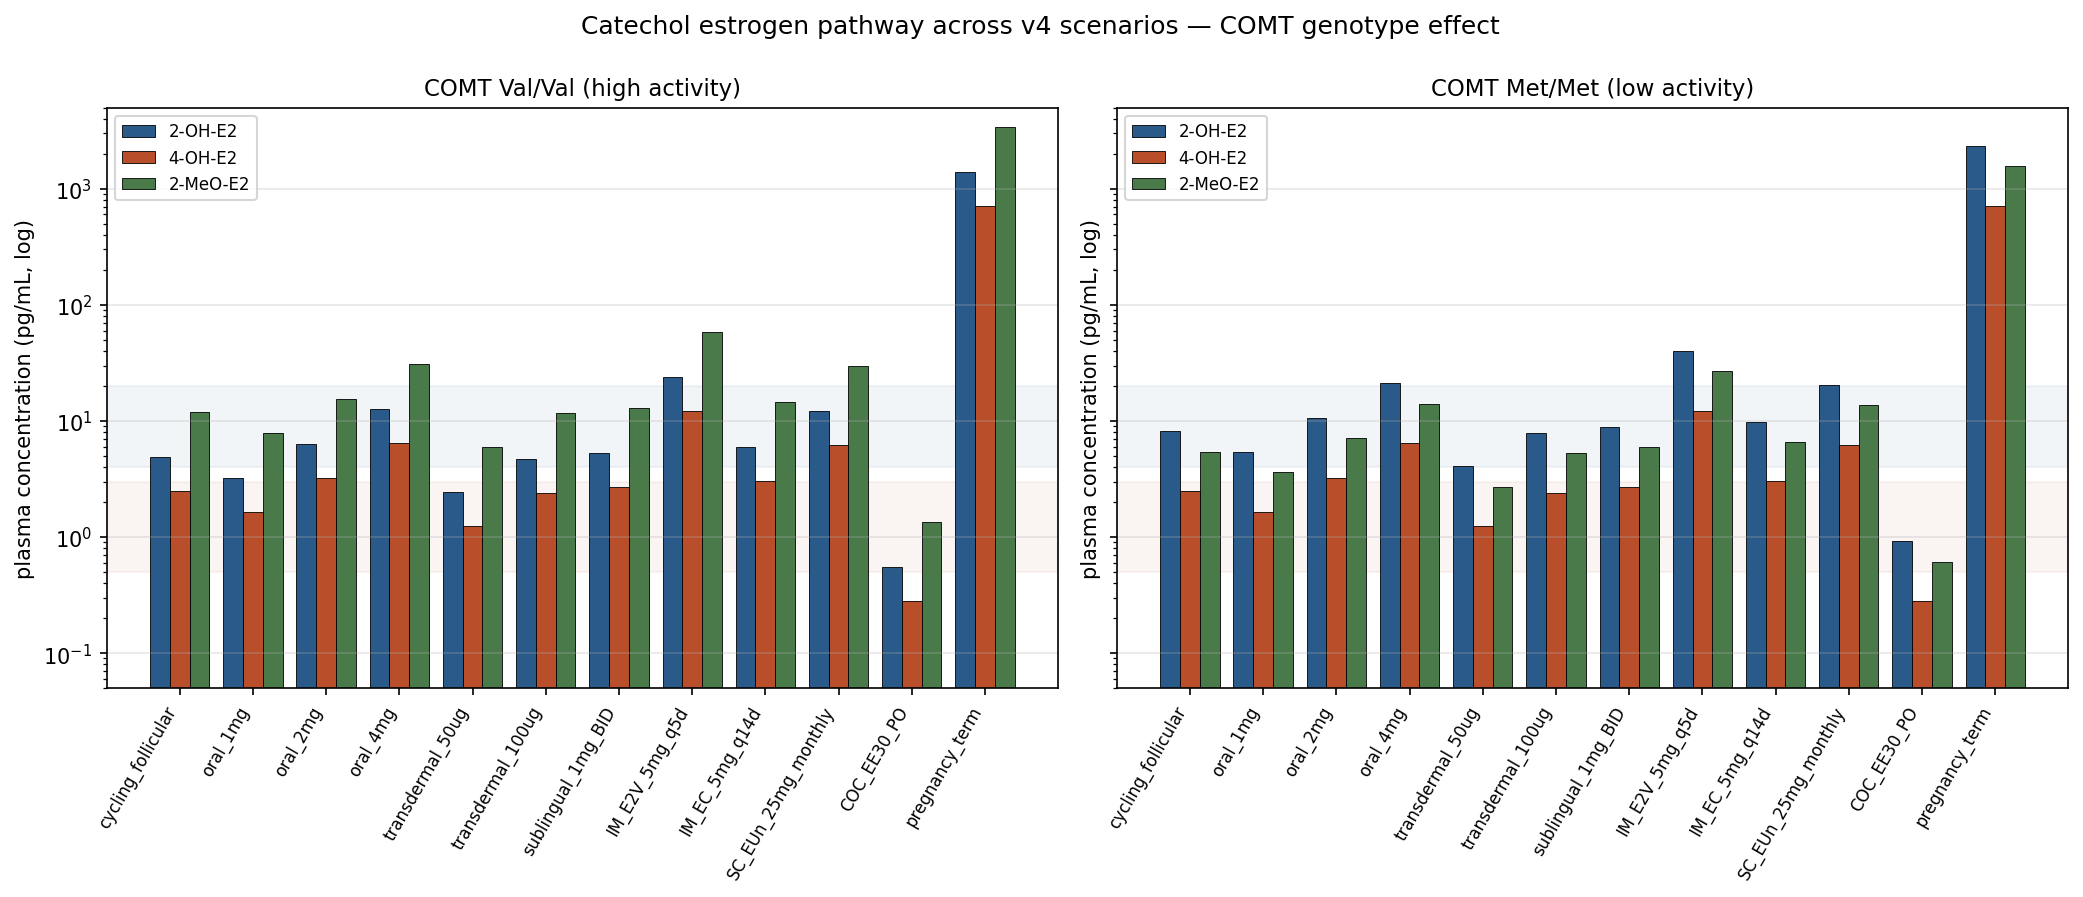
The catechol arm of E2 metabolism breaks into three downstream species that matter clinically: 2‑OH‑E2 (CYP1A1/1A2/3A4, ~30% of hepatic E2 clearance in the v4 module), 4‑OH‑E2 (CYP1B1, ~8%), and the methylated terminal products 2‑MeO‑E2 / 4‑MeO‑E2 made by COMT. (These hepatic‑flux fractions are higher than the ~5% “catechols / E3 / methylated” bucket cited in the mass balance above — the discrepancy is real and reflects that the older bucket counted only what is excreted as catechol or methoxy conjugates after sulfation/glucuronidation, while the catechol module tracks the fraction of E2 that passes through a catechol intermediate on its way to elsewhere.) The chemistry that makes 4‑OH‑E2 a candidate carcinogenicity driver is the same that makes 2‑MeO‑E2 anti‑proliferative: catechols can redox‑cycle to semiquinone and quinone intermediates that adduct DNA, but the methylated catechols are stable and have anti‑angiogenic / anti‑tubulin activity.C2 COMT prefers C2 hydroxyls over C4, so the methylation pump empties the 2‑OH‑E2 pool faster than the 4‑OH‑E2 pool — producing the steady‑state ratio of [4‑OH‑E2]/[2‑OH‑E2] ≈ 0.5 in the v4 catechol module after calibration to Bradlow 1995.C3
The COMT Val158Met polymorphism shifts this balance. The Val158 enzyme (~50% allele frequency in European populations) has ~3–4× the activity of the Met158 enzyme; Met/Met homozygotes (~25%) accumulate ~1.7× as much 2‑OH‑E2 and produce ~0.45× as much 2‑MeO‑E2 at the same parent‑E2 input (deterministic consequence of the v4 module's COMT methylation fractions Val 0.55 / Met 0.25).C3 Implication: the protective methylated‑catechol arm is genotype‑dependent in a way the standard PK summary tables do not capture. Pregnancy term levels (parent E2 ~20 ng/mL) push the model's 2‑OH‑E2 to ~1.4 ng/mL (Val) and ~2.3 ng/mL (Met) — ~290× the cycling baseline within the same genotype — consistent with the known elevated catechol burden in late gestation.C3
model/data/catechol_summary.json.C3Route determines two distinct quantities: how much parent drug reaches systemic circulation (F), and how much the hepatocyte sees on first pass (the portal‑vein concentration during absorption). These can diverge dramatically. Oral and sublingual deliver the dose through portal vein; transdermal, IM ester depot, and SC depot bypass it.
| Route (typical dose) | F | Single‑dose Cmax | Tmax | Hepatic load | E1:E2 |
|---|---|---|---|---|---|
| Oral E2 1 mg | ~5%C1 | ~35 pg/mLC1 | ~8 hC1 | Heavy (portal bolus) | 5:1 to 7:1C1 |
| Oral E2‑valerate (E2V) 1.5 mg | ~5% (as E2) | ~35 pg/mL | ~8 h | Heavy | ~5:1 |
| Sublingual E2 1 mg | ~5% direct (model); 20–25% in older textbooksC2 |
~140 pg/mL (80–400+ across studies)C1 |
1–2 hC1 | Substantial (swallowed fraction) | 2:1 to 3:1C2 |
| Transdermal patch 50 µg/d | N/A (delivered dose) | 50–80 pg/mL | steady-state | Minimal | ~1:1 |
| SC E2 (aq.) 1–4 mg | ~100% | 100–300 pg/mL | ~1–2 h | Minimal | ~1:1 |
| IM E2‑valerate 5 mg q5d | ~100% depot | ~667 pg/mL single dose; ~300 pg/mL q5d Cavg |
~2 d | Minimal | ~1:1 |
| IM E2‑cypionate (EC) 5 mg q14d | ~100% depot | ~338 pg/mL single dose | ~4 d | Minimal | ~1:1 |
| SC E2‑undecylate (EUn) 25 mg/mo | ~100% depot | 150–250 pg/mL | 1–2 wk | Minimal | ~1:1 |
| Oral EE 30 µg | ~45%C1 | ~70 pg/mL single dose; ~95 pg/mL steady stateC1 |
1–2 h | Maximal (recirculates) | (no E1) |
The E1:E2 ratio is a route signature. Premenopausal cycling produces ~1:1 (the ovary makes both, peripheral conversion adds a little). Transdermal and injectable routes give ~1:1 because they bypass the portal vein. Oral routes give 5:1 or higher because hepatic HSD17B2 runs the NAD⁺‑driven equilibrium during first‑pass.C1
Free‑E2 plasma bioavailability is ~5% for the parent drug; the apparent plasma half‑life is 13–20 h, much longer than the free‑E2 IV half‑life of 1–2 h.C1 The discrepancy is the E1S reservoir slowly back‑feeding the free pool via STS reactivation (§4). Steady‑state plasma E1S on 1 mg/d is 2,000–4,000 pg/mL (~50–100× the E2 level).C1 E2‑valerate is hydrolyzed to E2 + valeric acid by gut‑wall and plasma esterases within ~30 min, then behaves identically to oral E2 (MW correction: E2V is ~76% E2 by mass).
A third PK feature specific to oral routes is enterohepatic recirculation (EHR). The qualitative loop is well‑established: hepatocyte‑made E2 / E1 glucuronides are excreted into bile via the canalicular transporter MRP2, intestinal bacterial β‑glucuronidases (primarily in the distal small intestine and colon) hydrolyze a fraction back to free aglycone, and the deconjugated free E2 / E1 are reabsorbed across the enterocyte. The Adlercreutz & Martin 1980 review tabulates the cumulative biliary fractions of an administered dose: ~65% E2, ~48% E1, ~23% E3, with the rank-ordering reflecting the increasing polarity of E3 (which is preferentially renal-excreted).C2 Quantitatively, the loop's OUTPUT (reabsorbed fraction) is much less well-characterized than the input: Adlercreutz & Martin 1980 review the loop but explicitly say “the quantitative contribution of liver, kidneys, and intestine to estrogen metabolism cannot be accurately assessed at present,” and no subsequent human radiolabel study has cleanly partitioned biliary excretion vs reabsorption fractions for oral E2.C3 The qualitative signature is the broad 4–8 h plateau (instead of a sharp single peak) on oral PK curves and the 4–6 h secondary shoulder visible on the Goldzieher 1990 EE single‑dose curves below.C2 The popular “antibiotics raise contraceptive failure via EHR disruption” framing is mechanistically plausible but not supported by controlled human PK data: Adlercreutz 1984 found no significant plasma E2 / EE reduction during ampicillin co‑administration despite measurable fecal‑estrogen‑metabolite shifts; population‑level OC failure studies show a robust signal only for the rifamycins (which act via hepatic CYP3A induction, not via EHR).C3 The v4 model now has an explicit EHR extension (v4_ehr_ext.py, MODEL-PLAN #5 closed) that adds a bile compartment, 6 h gamma‑shaped transit, intestinal β‑glucuronidase deconjugation fraction (default 0.20), and enterocyte reabsorption fraction (default 0.70) layered on top of the baseline v4 oral‑E2 trajectory. The model's central‑parameter prediction: the EHR loop contributes only ~0.1% to plasma E2 AUC and ~0.1% to Cmax at steady state on oral 1 mg q24h. Sweeping the deconjugation fraction from 0.05 (broad‑spectrum‑antibiotic flora) to 0.30 (healthy gut) moves AUC by <0.3% — consistent with Adlercreutz 1984's controlled human PK finding that ampicillin co‑administration produces no significant plasma E2 / EE reduction. The folk‑PK 20–30% antibiotic AUC drop story is not supported by either the model or the controlled data; the loop is real and produces the visible plateau on the time course, but its quantitative plasma contribution is heavily attenuated by the same first‑pass that limits oral E2 bioavailability in the first place (each loop traversal sees only ~4% Foral on its way back to systemic plasma).C3
Some fraction of a sublingual dose absorbs across the buccal/sublingual mucosa directly to systemic circulation as free E2, bypassing portal first‑pass; the rest is swallowed and follows the oral route. Cmax is ~3–4× oral at the same doseC1 and the curve is distinctly biphasic: a sharp ~1.7 h early decline reflecting free‑E2's true IV‑like clearance, then a slower late tail driven by the smaller E1S reservoir from the swallowed fraction.C2 The absolute direct‑sublingual bioavailability has never been cleanly measured in humans. The v4 model uses ~5% (calibrated against Doll 2022's AUC ratio of 1.8× oral); older textbooks cite 20–25%; the only primary anchor for absolute F is the Kuhnz 1993 marmoset study at ~10%.C2
Sublingual is not reliably liver‑sparing. Cirrincione 2021 (LC‑MS/MS) finds sublingual produces plasma E1 levels closer to oral than to transdermal — meaning the swallowed fraction and the slowly redistributing direct fraction both hit hepatocytes.C1 Bar 2024 (ECE conference abstract, EP592) reports sublingual E2 produces meaningful free protein S depression, similar in magnitude to oral.C4
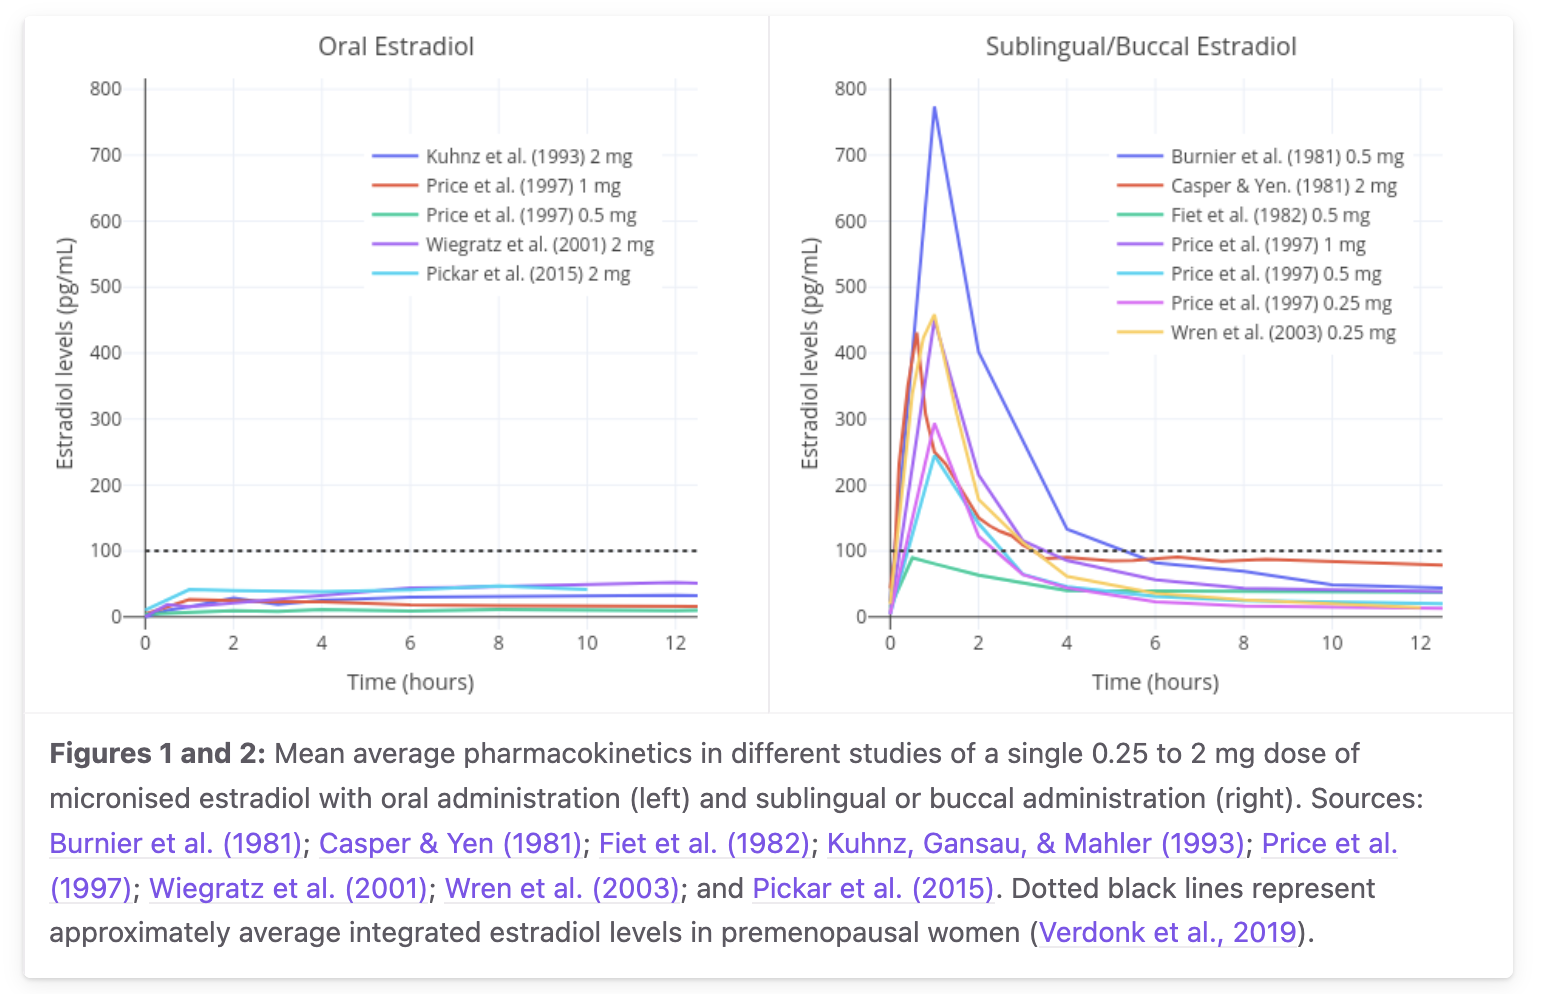
Aggregated mean curves from Burnier 1981, Casper & Yen 1981, Fiet 1982, Kuhnz 1993, Price 1997, Wiegratz 2001, Wren 2003, Pickar 2015 — single‑dose 0.25–2 mg micronized estradiol. Sublingual gives a sharp 1–2 h peak followed by fast biphasic decay; oral gives a broad ~8 h peak with smoother decline. Inter‑study Cmax spread for 1 mg SL is ~100–400+ pg/mL — a factor of 4. From transfemscience.org sublingual review. Model-vs-data digitization caveat: a pixel-extraction overlay of v4 predictions on the digitized curves (model/figures/v4/plot_overlay_transfemscience.png) shows v4 under-predicts the SL 1 h peak by ~5× (model ~158 pg/mL vs digitized ~770 pg/mL) and over-predicts the oral 12 h AUC by ~70% (model 694 vs digitized 416 pg·h/mL). v4's structural shape (broad oral peak vs sharp SL peak) is correct; the magnitudes need additional calibration.C3
Transdermal patch and gel deliver E2 directly to systemic circulation through skin, bypassing both gut and liver first‑pass. A 50 µg/d patch produces ~50–80 pg/mL steady state with E1:E2 ~1:1 and minimal SHBG induction. Hepatic exposure equals systemic exposure, so the receptor sees free E2 at sub‑Kd levels at typical doses — well below the SHBG EC50.C2
IM ester depots (E2‑valerate t½ ~2 d release, E2‑cypionate t½ ~6.5 d, E2‑undecylate t½ ~22 d) hydrolyze in the depot and slowly release free E2 into systemic circulation. Single‑dose IM E2V 5 mg peaks at ~667 pg/mL around day 2; IM EC 5 mg at ~338 pg/mL around day 4 (peak values commonly understated as ~200/~100 pg/mL in earlier drafts of this synthesis — those are Cavg, not Cpeak). SC E2 aqueous and depot routes are increasingly used in trans HRT for self‑injection convenience; PK matches the IM equivalent ester.
Oral E2‑valerate is essentially oral E2 from minute 30 onward; oral EC and EUn are less commonly used orally (the longer aliphatic chains slow ester hydrolysis but most clinical use is parenteral depot). The European HRT and COC market (Climen, Qlaira) uses E2V as the oral E2 source by convention; the US market uses unesterified E2.
Hepatic ER‑α (ESR1) is the molecular mediator of route‑dependent estrogen effect on the liver. When activated, it transcriptionally upregulates coagulation factors II, VII, VIII, IX, X, XI, fibrinogen, SHBG, CBG, TBG, angiotensinogen, IGFBPs, HDL, and triglycerides; and downregulates protein S, antithrombin, and IGF‑1. The net hemostatic shift is procoagulant, and it tracks the concentrations the hepatocyte sees — not systemic plasma E2.
The single most important framing correction from round‑2 fact‑checking: receptor occupancy and SHBG induction are governed by two different dose‑response curves at very different concentrations. Earlier drafts conflated them under one Hill curve at Kd = 0.25 nM (~68 pg/mL free), concluding “routes below ~68 pg/mL avoid hepatic effects.” This is too crisp.
Two different Hill curves drive two different things. Occupancy saturates around the Kd; SHBG induction needs roughly 20× higher exposure. Transdermal stays below both. Pregnancy saturates the receptor, but this acute curve under‑predicts the observed 5–10× SHBG rise at ~300 pg/mL — the gap reflects months‑long sustained hepatic exposure (vs this in‑vitro acute curve) plus direct placental SHBG output and HepG2 under‑predicting primary hepatocytes, not an hCG driver (see the pregnancy‑SHBG evidence card). Oral first‑pass pushes hepatic concentration onto the steep / upper‑arm region of the SHBG induction Hill curve (5000/(5000+1150) ≈ 81% of model maximum, n=1 — high on the rising arm, not fully saturated). Units convention: the x-axis here is free hepatocyte E2; the §2 transdermal PK table value of 50–80 pg/mL is total plasma E2, which corresponds to ~1.4–2.2 pg/mL free at typical free fraction ~2.8% — the mechanism behind oral HRT's hepatic effect despite modest systemic E2.
The “two curves” above separate occupancy from induction along the concentration axis. They are also separated along the time axis, and the time gap is what makes the protein readout sluggish. A single oral dose floods the hepatocyte for only minutes during first‑pass, but the protein it ultimately changes — SHBG, clotting factors — turns over across days. The signal therefore passes through a ladder of increasing time constants:
Schematic log‑time axis (illustrative spacing, not to exact scale). Each step integrates the one above it, so the clinically measured output (plasma SHBG, clotting factors) lags the minutes‑long first‑pass E2 pulse by days. Time constants: association/occupancy reflect a near‑diffusion‑limited on‑rate with a slow off‑rate (estradiol–ER dissociation t½ ~90 min–2 h in classic ER systems; C3) and ER‑α Kd ~0.25 nM (C3); mRNA induction from the HepG2 dose‑response literature (C3); SHBG terminal half‑life ~4 days from Namkung et al. 1989 primate tracer data (C2). Diagram constructed for this synthesis.
Plasma protein levels track the concentrations the hepatocyte sees during absorption, not the systemic E2 level. Oral E2 at 1 mg/d produces ~50 pg/mL systemic plasma E2, while the v4 model estimates a transient portal/hepatocyte free‑E2 exposure around ~5000 pg/mL during absorption; this portal figure is model‑derived, not directly measured (no human portal‑vein E2 study exists).C3 Pregnancy is the cleanest natural contrast for the “route, not dose” claim: term pregnancy plasma E2 reaches roughly hundreds‑fold above cycling baseline (tens of thousands of pg/mL), yet pregnancy VTE risk is only about 3–10× baseline (CDC summary ~5× overall; trimester/postpartum estimates vary).C1 The route/exposure explanation — that pregnancy delivers estrogen placenta‑to‑systemic rather than as a portal‑vein bolus, so the liver sees a sustained rather than spiked signal — is a mechanistic inference, not a directly measured causal decomposition.C3
SHBG enters the story twice. The previous subsection covered SHBG as a hepatic transcriptional output (the protein the liver makes more of under oral‑style first‑pass exposure). It is also the dominant carrier for E2 in plasma, and the two roles couple: raising SHBG output lowers the free fraction of every steroid SHBG carries, which feeds back on how much hormone reaches peripheral receptors. This subsection treats the carrier role.
Circulating E2 partitions across three pools. In a non‑pregnant adult only ~2–3% is unbound (“free”); ~38% is bound to SHBG and ~60% to albumin.C1 The free‑hormone hypothesis holds that only the unbound steroid crosses cell membranes to reach intracellular ER, so it is free — not total — E2 that sets receptor occupancy. A weaker variant, the bioavailable‑hormone model, counts free + albumin‑bound together, on the grounds that the albumin complex dissociates fast enough during capillary transit to surrender hormone to tissue; the SHBG‑bound pool is treated as sequestered. Which model is “correct” is tissue‑ and transit‑time‑dependent and still debated; both agree the SHBG‑bound fraction is the least available.C3
| Carrier | Kd for E2 | Plasma concentration | Character |
|---|---|---|---|
| SHBG | ~10–30 nM structural; ~1.5–5 nM operative |
~20–100 nM (~50 nM typical) |
High affinity, low capacity; readily saturable; slow off‑rate (sequestering) |
| Albumin | ~10–30 µM (~10³× weaker) |
~600 µM (~40 g/L) |
Low affinity, enormous capacity; never saturable; fast off‑rate (readily dissociable) |
Albumin's affinity for E2 is three to four orders of magnitude below SHBG's, but its plasma concentration is ~1000× higher (Hammond 2016), so the two carriers end up holding comparable shares of E2.C2 Because neither protein is more than slightly occupied by the small steroid pool, the free fraction has a simple closed form:
ff ≈ 1 / (1 + [SHBG]/Kd,SHBG + [alb]/Kd,alb)ff ≈ 1/(1+10+25) ≈ 2.8%, partitioned ~10/36 (~28%) SHBG‑bound and ~25/36 (~70%) albumin‑bound — the right free fraction and the right ordering (albumin ≥ SHBG ≫ free), though this constant choice under‑weights the SHBG share relative to the canonical ~2/38/60. Matching 38/60 exactly needs a tighter operative SHBG constant: Kd,SHBG ~2.6 nM (SHBG term ~19) with albumin term ~30 gives ff ≈ 1/(1+19+30) ≈ 2.0%, 38% SHBG, 60% albumin.C3 The two terms are additive in the denominator, so raising [SHBG] lowers ff for every ligand SHBG carries.
Published SHBG–E2 Kd values span ~1.5–30 nM across assays. Structural/equilibrium work reports ~10–30 nM (Avvakumov 2010), whereas the operative constant embedded in clinical free‑hormone calculators (Vermeulen‑type, ~1.5 nM) is several‑fold tighter — partly because SHBG is a homodimer presenting two binding sites, and partly assay convention. The page uses ~20 nM as the molecular constant and a tighter ~2–5 nM operative value for free‑fraction arithmetic. The gap is not a temperature effect: SHBG–steroid affinity actually decreases (weakens) with rising temperature, so it is slightly lower at 37°C than in cold (4°C) assays for all three steroids (PMID 3702439) — the opposite direction from the structural-vs-operative gap.C2
SHBG does not bind all steroids equally. Its affinity ranks DHT (~1 nM) > testosterone (~3–5 nM) > estradiol (~20 nM) — androgens bind several‑fold tighter than E2.C1 In the free‑fraction equation, a tighter Kd means the [SHBG]/Kd term grows faster as SHBG rises, so the higher‑affinity ligand loses a larger proportion of its free fraction. Oral E2 raises SHBG ~67–171% (dose‑dependent; Ropponen et al. 2005);C1 that same SHBG rise suppresses free testosterone and free DHT proportionally more than it suppresses free E2 — a feature, not a bug, in transfeminine HRT, where the goal is to lower free androgen while maintaining free estrogen. It is also the mechanism behind the antiandrogenic reputation of oral (vs transdermal) estrogen and of EE‑containing combined oral contraceptives.
SHBG is unusually dynamic for a plasma carrier. Across healthy adults it spans ~20–100 nM (men lower, women higher); pregnancy — the largest sustained physiological estrogen exposure — raises maternal SHBG roughly 5–10× over the non‑pregnant level (Anderson 1976: ~5×, with later assays reporting up to ~10× at term).C2 The same study clocks the postpartum decline at a ~7‑day half‑life — an independent human cross‑check on the multi‑day SHBG turnover that sets the ~2–4‑week lag before plasma SHBG reaches a new steady state after any estrogen dose change.C2 Because [SHBG] enters the free‑fraction denominator directly, this several‑fold dynamic range is what makes route‑ and dose‑driven SHBG shifts clinically meaningful for free‑hormone exposure.
The clinical consequence of the slow protein turnover is that SHBG — and the free fraction it sets — lags any dosing change by weeks. Starting, stopping, or switching the route of oral estrogen does not move SHBG to its new level on the next dose; the plasma pool fills (or drains) along a first‑order curve parameterized by the SHBG clearance half‑life, ~4 days (primate tracer) to ~7 days (postpartum human); the exponential time constant is τ = t½/ln 2 (~5.7–10.2 days), so it is somewhat longer than the half‑life itself.C2 A laboratory SHBG (or a free‑testosterone) drawn one week into a regimen change is therefore reading a value still in transit, not the steady state.
Modeled SHBG approach to a new steady state after a step change in hepatic estrogen exposure, SHBG(t)/ΔSS = 1 − e−t/τ with τ = t½/ln2. The band spans the two cited clearance half‑lives: ~4 days (Namkung et al. 1989 primate 125I‑SHBG tracer, terminal t½ 3.95 d) and ~7 days (Anderson 1976 postpartum decline, t½ 7.1 d).C2 Protein turnover — not ligand association/ER occupancy (minutes–hours, because the ER off‑rate is slow) or mRNA induction (hours) — is the rate‑limiting step, so plasma SHBG reaches ~50% of its new level at one half‑life (~4–7 d), ~75–91% by two weeks (shaded), and effective plateau by ~3–4 half‑lives (~2–4 weeks). The washout after stopping oral estrogen is the mirror image (same time constant). Diagram constructed for this synthesis; the exponential form is a single‑compartment approximation, the half‑life inputs are the cited measured values, not a fit to a clinical SHBG‑ramp dataset.C3
Free fraction of E2, testosterone, and DHT vs plasma SHBG, computed from ff = 1/(1 + [SHBG]/Kd + A) using operative SHBG Kd values of ~5 nM (E2), ~1.6 nM (T), ~1 nM (DHT) and a fixed albumin term A of 24/18/15 respectively (the on-curve labels show these operative constants, not the larger structural Kd). Relative SHBG affinities (DHT>T>E2) are from the structural literature (see text above; C1); the absolute operative constants are representative values chosen to land near the known physiological free fractions (E2 ~2–3%, T ~2%, DHT ≤~1.5% at 50 nM SHBG), not measured points.C3 From SHBG‑free to the top of the plotted range (150 nM), free DHT falls to ~10% of its SHBG‑free value while free E2 falls only to ~45% — the higher‑affinity ligand is suppressed more by the same SHBG rise. The shaded band marks the typical adult SHBG range (~20–100 nM). Diagram constructed for this synthesis; affinity ordering verified against Avvakumov & Hammond 2010 and Hammond 2016.
The clinical signature of this hepatic effect is its route dependence: the same molecule raises SHBG sharply by mouth and barely at all through skin, because only the oral route delivers the first‑pass portal concentration spike that drives hepatic ER well into the upper-arm region of the SHBG induction curve. Ropponen et al. 2005 measured exactly this contrast in a within‑subject crossover, and it is the single cleanest demonstration that route, not systemic E2 level, sets the hepatic readout.
SHBG change from baseline across the four treatment arms of Ropponen et al. 2005, a randomized double‑blind crossover in 40 postmenopausal women (with/without a history of intrahepatic cholestasis of pregnancy, ICP). Increasing oral E2 raised SHBG +67 to +171% in controls (the wider end of the bar = higher doses) and a blunted +42 to +121% in the ICP group, while transdermal E2 produced no significant SHBG change; adding medroxyprogesterone acetate (MPA) lowered SHBG 14–18% on either route. The oral/transdermal split is the route‑dependence signature: same hormone, opposite hepatic readout, because only the oral route delivers the first‑pass portal spike. Bars are the reported ranges (not per‑dose points; the paper's abstract does not break the range out by individual dose).C1 Source: Ropponen A et al. 2005, J Clin Endocrinol Metab 90(6):3431–3434, doi:10.1210/jc.2005-0352, JCEM abstract (see the Ropponen evidence card). Figure constructed for this synthesis from the abstract's reported percentages.
Estrone‑3‑sulfate (E1S) is the most abundant circulating estrogen species in every hormonal state. It is metabolically inert at ER itself (sulfate group blocks C3 binding) but is reactivated to E1 in target tissues by STS, then reduced to E2 by HSD17B1. Its plasma half‑life of 10–12 h (Ruder 1972) makes it the rate‑limiting step for the apparent elimination of oral E2.C1
| Population / state | Plasma E1S | Ratio to free E2 |
|---|---|---|
| Adult men | 700–1500 pg/mL | ~30× |
| Premenopausal women, follicular | ~960 pg/mL | ~5–15× |
| Postmenopausal women | 200–700 pg/mL | ~30–100× |
| Oral 1 mg E2 HRT, steady state | 2,000–4,000 pg/mL | ~50–100× |
| Transdermal 50 µg/d patch | ~600 pg/mL | ~10× |
| Pregnancy, third trimester | ~100,000 pg/mLC1 | ~5× |
Postmenopausal endogenous E1 production is ~40 µg/day (Longcope 1986; Grodin 1973), not ~80 µg/day as earlier drafts had it — that higher number was likely a premenopausal early‑luteal value misapplied to postmenopause.C1
The reservoir explains the long apparent oral half‑life. Free E2 itself clears with IV t½ of 1–2 h. The 13–20 h apparent half‑life of oral E2 is the rate at which the E1S reservoir bleeds back into the free pool: ~320 µg‑equivalent of a 1 mg oral dose enters systemic E1S, then reactivates over 12–24 h via STS in target tissues.C2 Sublingual loads a smaller reservoir (only the swallowed fraction enters portal first‑pass), giving a shorter, sharper plasma curve. Transdermal builds essentially no oral‑style reservoir — the steady‑state E1S elevation comes from peripheral E2→E1→E1S conversion at standard cycling rates.
The clinical end‑point of route‑dependent hepatic exposure is venous thromboembolism (VTE). Oral estrogen elevates risk roughly 4× baseline; transdermal does not.C1
| Therapy | VTE OR / RR | Source |
|---|---|---|
| Healthy non‑pregnant baseline | 1.0× | — |
| Transdermal E2 HRT | 0.9× (95% CI crosses 1.0; no significant elevation, not "protective") | ESTHER (Canonico 2007, adjusted OR)C1 |
| Oral E2 HRT (1–2 mg) | ~4.2× | ESTHER (Canonico 2007, adjusted OR)C1 |
| Oral E2 HRT (pooled meta‑analyses) | ~1.5–1.8× | Scarabin 2015; Vinogradova 2019C1 |
| Oral CEE (conjugated equine estrogens) | ~3–4× | Same mechanism + equilin sulfate effects |
| EE‑based COCs (30 µg) | ~3–4× | Stegeman 2013C1 |
| Pregnancy, 3rd trimester | ~7–10× | Cohort meta‑analyses; hepatic + venous compression + reduced mobility |
| Postpartum 6 weeks (C‑section) | ~25–35× | Lingering hepatic + surgical injury + immobility |
| COC + Factor V Leiden heterozygote | ~20–35× | Multiplicative with hereditary thrombophilia |
The ESTHER 4.2× figure is from the original case‑control study (Canonico 2007, Circulation, PMID 17309934); pooled meta‑analyses dilute the signal because they include lower‑dose oral regimens and heterogeneous transdermal protocols. The 4.2 vs 0.9 contrast is the load‑bearing population‑level number behind modern guideline preference for transdermal over oral.C1
Pregnancy plasma E2 is ~250× cycling baseline; pregnancy VTE risk is ~3–10×. The intuitive question is how the 250× plasma signal is buffered down to a 3–10× clinical signal. Earlier drafts presented a stepwise multiplicative chain (÷3 SHBG buffering × ÷30 SHBG induction saturation × ÷2 TFPI/protein S compensation × ×3 Virchow's triad) terminating at the empirical risk. The round‑2 fact‑check found multiple invented multipliers in this chain, and it is now framed strictly as a heuristic:
The qualitative claim — plasma E2 ≠ free E2 ≠ hepatic effect ≠ net coagulation ≠ VTE incidence — is fully supported. The specific multipliers are not. Read the chain as a teaching device for the structure of attenuation, not as a sourced calculation.
Ethinyl estradiol (EE) is 17α‑ethinyl‑17β‑estradiol. The single 17α‑ethinyl substitution makes C17 a quaternary carbon — bearing the 17β‑OH, the 17α‑ethinyl (−C≡CH), and the two ring carbons C13/C16 — with no carbinol hydrogen for HSD17B2 to abstract.C1 The 17β‑OH is still there. An earlier draft of this synthesis incorrectly stated that EE has “no C17‑OH” — the round‑2 codex fact‑check caught this. The chemistry is right (HSD17B2 cannot oxidize EE), the prior wording was wrong.C1
The mechanistic consequences:
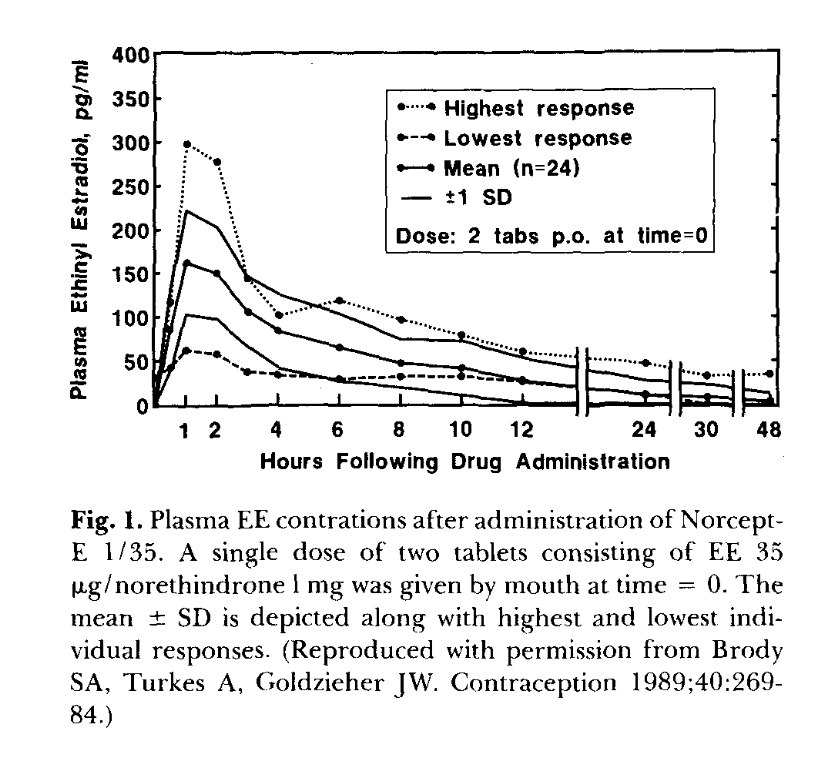
Brody, Turkes & Goldzieher 1989, Contraception 40:269 (reproduced by Goldzieher 1990). Single‑dose 2‑tablet (= 70 µg EE) administration to n=24 women. Mean Cmax ~160 pg/mL at 1 h; highest‑responder peak ~300 pg/mL — 5× the lowest responder. The 4–6 h plateau is enterohepatic recirculation. The 5× spread at n=24 with the same drug and dose is the inter‑individual variability the model curves do not show. Model-vs-data digitization caveat: v4 overlay (model/figures/v4/plot_overlay_goldzieher.png) shows v4 under-predicts the EE 1 h peak by ~2× (model 78 pg/mL vs digitized 166 pg/mL) but matches the 12–48 h terminal slope (model −0.059/h vs digitized −0.050/h). v4's EE absorption rate is too slow; this is a known model limitation that the §6 EE single‑dose validation hasn't yet been retuned for.C3
| Formulation | SHBG rise from baseline |
|---|---|
| EE 20 µg + LNG 100 µg (Alesse) | +80 to +150% |
| EE 30 µg + LNG 150 µg (Microgynon) | +100 to +150% |
| EE 30 µg + desogestrel 150 µg | +200% |
| EE 30 µg + drospirenone 3 mg (Yasmin) | +200 to +300% |
| EE 30 µg + dienogest 2 mg | +320% |
| EE 35 µg + cyproterone 2 mg (Diane‑35) | +400% |
| EE >50 µg (older COCs) | +500 to +1000% |
Source: Stegeman 2013, J Thromb Haemost.C1 Androgenic progestins (LNG) blunt SHBG rise; antiandrogenic ones (drospirenone, cyproterone) amplify it. Diane‑35 reaches roughly pregnancy‑level SHBG. The estrogen choice (EE vs E2‑valerate) matters at least as much as the progestin choice — Qlaira (E2V + dienogest) sits at +50–80% SHBG and ~4–6/10,000 woman‑years VTE, vs Yasmin's +200–300% SHBG and ~10–12/10,000 woman‑years.
The unsolved formulation problem: design an oral E2 prodrug that delivers physiological systemic E2 levels without hepatic ER‑α saturation. The chemical approach attempted twice: install a sulfamoyl group (−SO2NH2) that tightly ligates the active‑site Zn2+ of carbonic anhydrase II (CAII) inside red blood cells. RBC sequestration carries the drug past the liver in the cellular compartment rather than as free drug in plasma; plasma esterases then slowly release E2 in systemic circulation.
E2MATE (estradiol‑3‑sulfamate) installed the sulfamoyl group on the C3 phenolic oxygen. This protected C3 from SULT/UGT and bound CAII, but the C3‑O‑SO2NH2 bond is also recognized by STS. Instead of being cleanly cleaved to release E2, the sulfamate covalently modifies STS's active‑site formylglycine residue via mechanism‑based sulfamoyl transfer.C1 The FGly‑N‑sulfate adduct is stable; STS is permanently inactivated; both the prodrug's own activation and the body's normal E1S reactivation cycle are abolished. This is a mechanism‑based irreversible inhibitor, not a transition‑state mimic — earlier drafts of this synthesis described it as a TSI, which is the wrong mechanistic class (round‑2 mechanism fact‑check finding 1).C1 E2MATE has been repurposed as an STS inhibitor for endometriosis.
EC508 = estradiol‑17β‑(1‑(4‑(aminosulfonyl)benzoyl)‑L‑proline). The redesign moves the sulfamoyl group off the C3 oxygen (where STS attacks) and onto a separate L‑proline‑based handle attached at C17 via an esterase‑cleavable ester linker.C2 Estradiol is intact; the sulfamoyl head ligates CAII inside RBCs; plasma esterases slowly cleave the C17 ester bond to release free E2 plus a prolyl‑aryl‑sulfonamide fragment.
EC508 architecture. Estradiol (left, neutral ink) is preserved with C3‑OH intact and only the C17‑OH esterified. The C17 ester (coral) is the cleavable bond. L‑proline (blue) provides the linker: Cα carries the ester, ring N carries the acyl group to the para‑sulfamoyl‑benzoyl head. The sulfamoyl (red) ligates the CAII active‑site Zn2+ inside RBCs — the molecule hides in the cellular blood compartment during portal transit, then slowly hydrolyzes to free E2 systemically.
Development status: EC508 was developed by Evestra Pharmaceuticals. As of 2021, the transfemscience.org EC508 article notes “No Further Development.” It never progressed to human clinical trials; small‑pharmaceutical funding constraints are the most plausible explanation. The chemistry works in principle and in animals.C2
Real PK variability is much larger than central‑estimate tables suggest. The Goldzieher 1990 reproduction of Brody/Turkes/Goldzieher 1989 shows a 5× spread in single‑dose oral EE Cmax across n=24 women receiving identical 70 µg doses.C1 Stanczyk 2013 reviews comparable spreads across oral and transdermal E2.C1 Drivers of variability:
Bimodal oral EE bioavailability has been reported in some studies, with a high‑F subpopulation distinct from a low‑F majority.C2 Clinical implication: literature central‑estimate doses are starting points, not endpoints. Real PK has CV ~30–60% on most parameters and follow‑up bloodwork is essential for any HRT regimen targeting a specific E2 range.
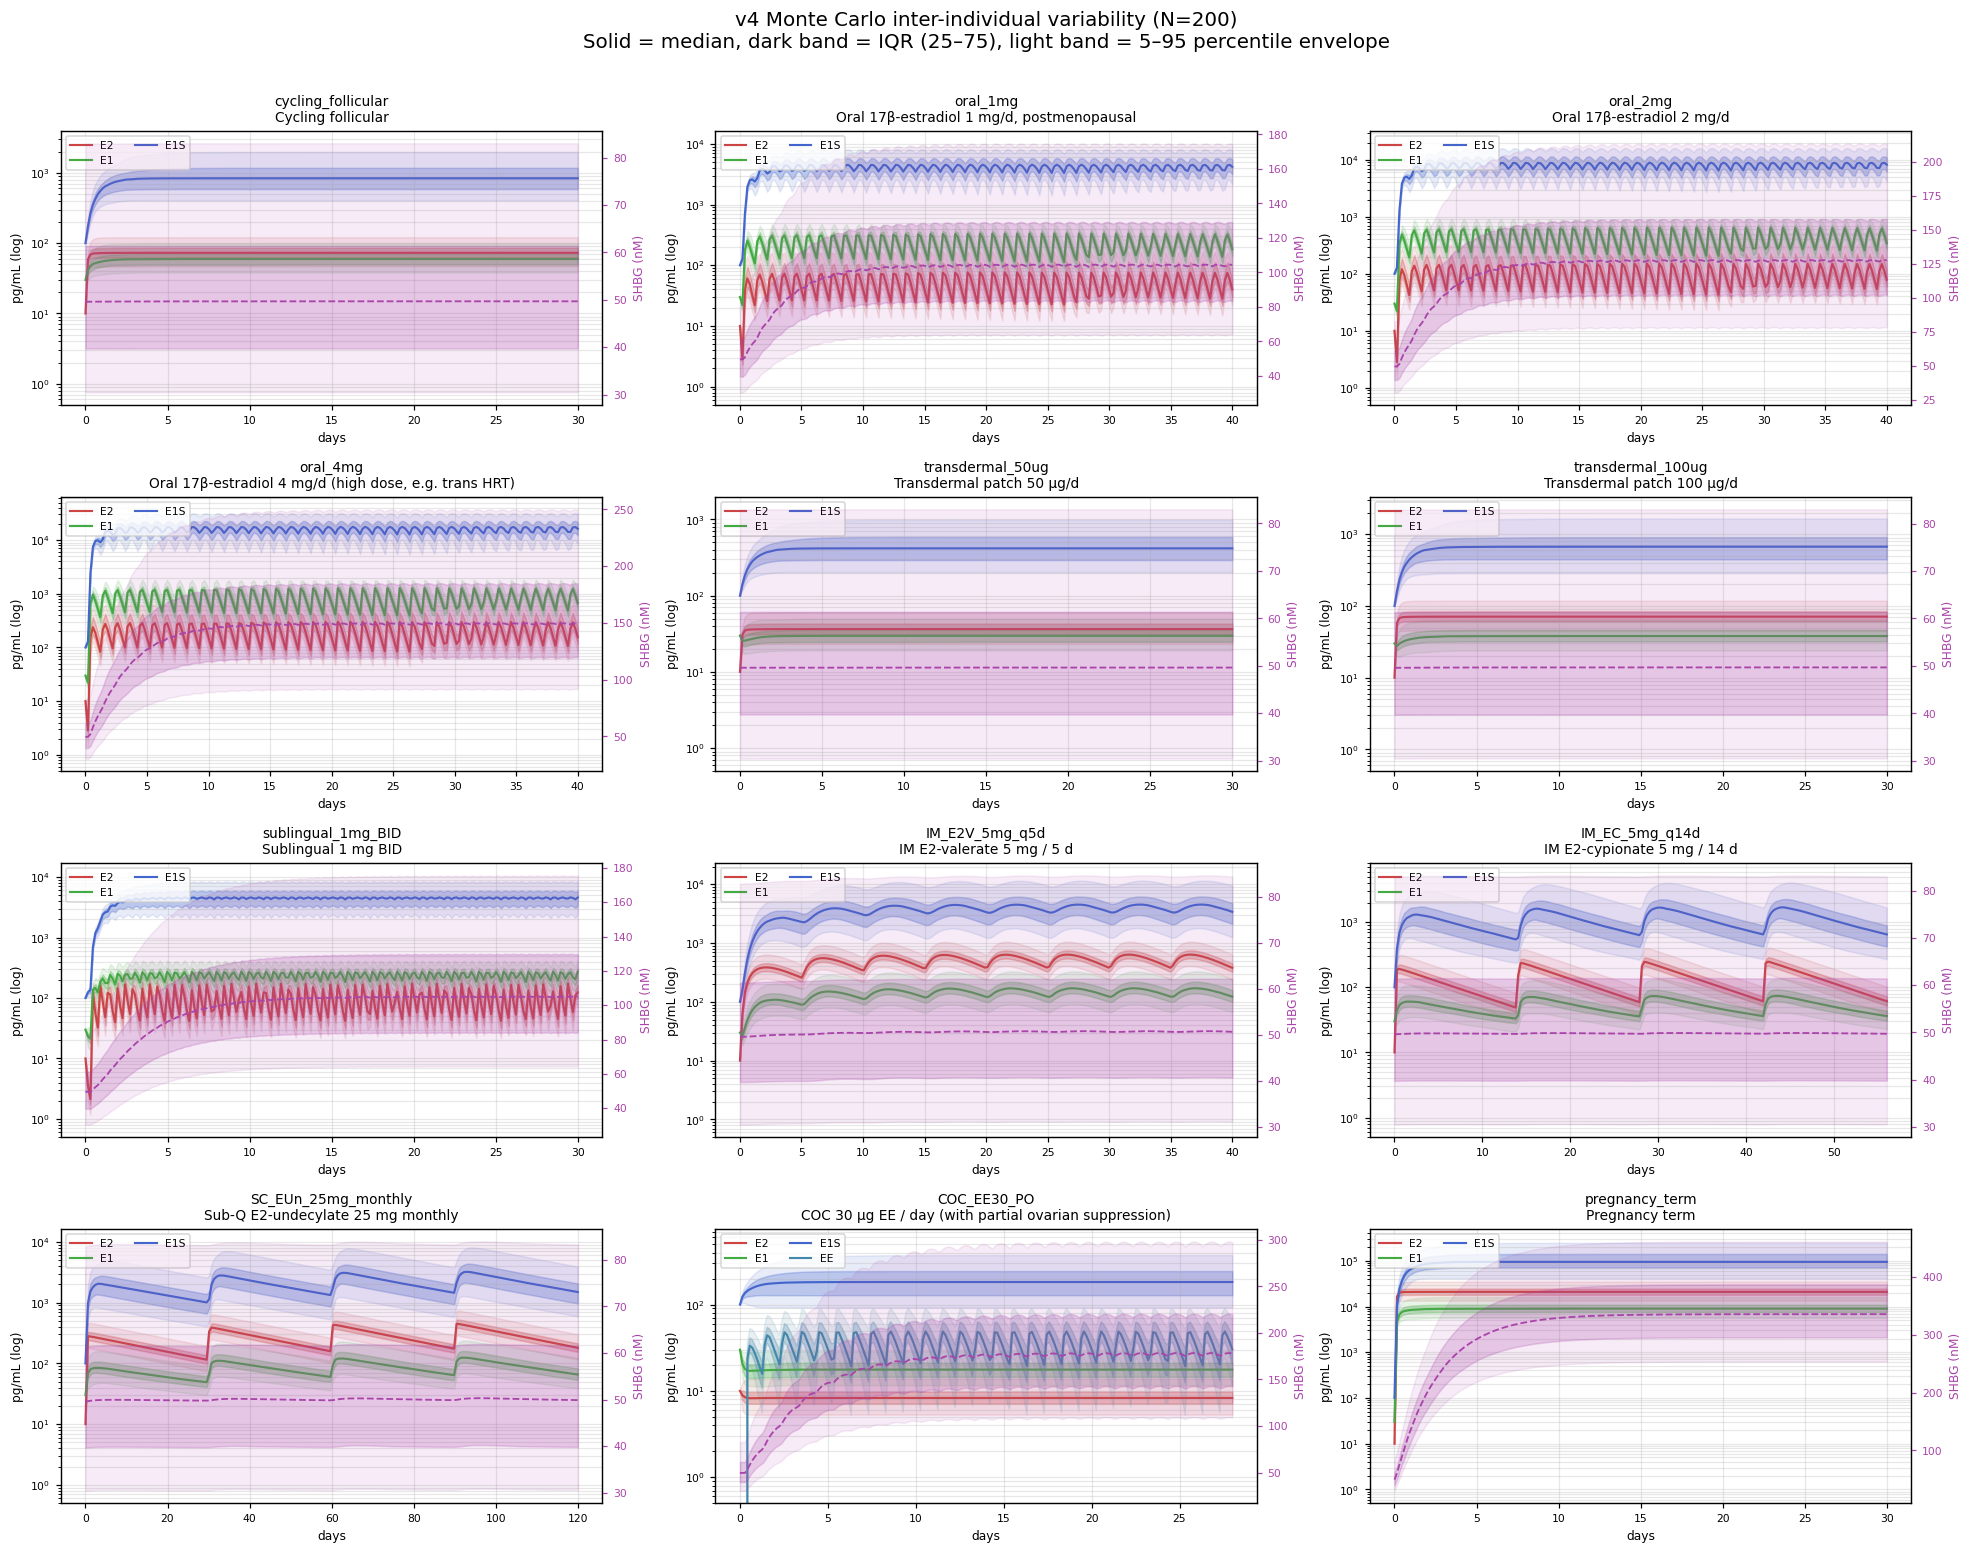
The deterministic curves elsewhere in this document collapse a population to its central tendency, which is exactly the visual lie the field has been making for decades. To put a number on the envelope, the v4 model was run as a 200‑sample Monte Carlo (12 scenarios × 200 ODE integrations) with nine of its parameters sampled from log‑normals centred on the deterministic values: MCR of E2 / E1 / E1S / EE (CV 28–45%, from Longcope 1968 and Ruder 1972 dispersion), the SULT1E1 and HSD17B2 throughput constants (CV 40–50%, from the SULT/HSD expression‑polymorphism literature), SHBG baseline (CV 30%, Vermeulen 1969 / WHO), and the oral bioavailability of E2 and EE (CV 30–60%, the dominant source of inter‑individual variability).C2
For oral E2, the model produces a p95/p05 steady‑state spread of ~3.8× across the 1 mg, 2 mg, and 4 mg dose levels — matching the Goldzieher 1989 / Stanczyk 2013 reported responder range of 3–5× without explicit tuning (the per-parameter CVs in the Monte Carlo wrapper are drawn from primary literature, not fit to the responder-range target). For oral EE 30 µg in COC, the spread is ~4.7×. For transdermal, IM ester, and SC depots, the spread is tighter at ~2.6× — but this is because the only variance these routes inherit in the model is whole‑body MCR (CV ~28%, log‑normal); the gut Foral variability that dominates oral PK is bypassed by construction, not modeled away. So the comparison reads “oral spread = MCR variability × Foral variability, multiplied; non‑oral spread = MCR variability alone.”C2 The takeaway holds clinically — oral routes do amplify population PK variability in real life — but the ~2.6× non‑oral number should be read as the model's MCR‑only floor rather than an independent prediction. A real patient lands somewhere inside the light envelope below, not on the median line.
model/data/mc_summary.json & mc_results.npz.C2Single‑dose PK and steady‑state PK differ in three ways relevant to HRT.
Accumulation. For a drug with apparent t½ longer than the dosing interval, plasma concentrations accumulate to steady‑state values of (single‑dose) × (accumulation factor). For oral E2 (apparent t½ ~15 h, q24h dosing) the accumulation factor is ~1.4×. For EE (t½ ~20 h, q24h) it is 1.5–2× (Yasmin label: single‑dose 30 µg Cmax ~70 pg/mL → steady‑state ~95 pg/mL).C1
E1S reservoir loading. The reservoir takes ~3–5 days (3–5× E1S t½ of 10–12 h) to reach steady state. Until then, plasma E2 trough is lower than it will be at chronic dosing — new oral HRT patients commonly under‑estimate their eventual steady‑state level from day‑1 measurements.
SHBG transcriptional time constants. SHBG protein turnover sets a slow time constant of ~4 days; chronic dose changes don't show in plasma SHBG for ~2 weeks. Clotting factor changes are faster (~3–7 days) but still substantially slower than the PK time constants. Single‑dose hepatic effects are essentially undetectable; only chronic dosing produces the protein‑synthesis shifts that drive VTE risk.
Practical estrogen choices in transfeminine HRT, with the synthesized pharmacology applied to clinical decisions.
| Formulation | Pros | Cons | Common clinical rangeC2 |
|---|---|---|---|
| Oral E2 (estradiol or E2‑valerate) | Cheap, available, easy to titrate | VTE elevation (ESTHER ~4.2×) | 2–6 mg/d |
| Sublingual E2 | Higher Cmax than oral at same dose | Sharp peaks; uncertain absolute F; not reliably liver‑sparing | 2–6 mg/d split BID–TID |
| Transdermal patch | Minimal VTE risk; smooth PK | Expensive; adhesion issues; titration in fixed increments | 100–200 µg/d |
| Transdermal gel | Minimal VTE risk; flexible dose | Skin‑contact transfer risk; absorption varies with skin site | 1.5–6 mg/d gel |
| IM E2‑valerate | Stable levels at q5–7d; low VTE risk | Injection logistics; needle anxiety | 4–10 mg q5–7d IM |
| IM E2‑cypionate | Stable at q7–14d | Same as IM EV | 3–5 mg q7d IM |
| SC E2 (aqueous or ester) | Self‑administered; thin needle; flexible dose | Injection schedule discipline | 1–6 mg q4–7d SC |
(The “Common clinical range” column in the table above reflects ranges in routine clinical use; Endocrine Society 2017 lists oral E2 2–6 mg/d and patch 0.025–0.2 mg/d, but the SC E2 1–6 mg q4–7d and IM EV 4–10 mg q5–7d ranges are common practice patterns not directly tabulated in the guideline. Not dosing advice.)
Target serum E2: guidelines usually frame the goal as roughly 100–200 pg/mL (or simply E2 <200 pg/mL to avoid the supraphysiologic range), with serum testosterone monitored separately toward the female range (~30–100 ng/dL).C2 Within-population PK spread is ~3–5× at a fixed dose (§8), so a single reading is a feedback-loop check, not a measurement of where a particular patient actually sits at steady state — and SHBG / free-T draw at <2 weeks after any dose change reads a value still in transit (§3). The ~100 pg/mL lower bound is commonly cited as roughly the threshold for adequate gonadotropin suppression in monotherapy, but a 2025 systematic review found the evidence does not establish that any specific E2 range guarantees feminization sufficiency — so the range is a pragmatic monitoring target, not a proven feminization optimum.C2 The feminization process itself unfolds over years, not lab draws: Endocrine Society 2017 notes early changes over 3–12 months with breast development generally maximal around 2 years; UCSF guidance describes breast development as usually Tanner 2–3 with maximal feminization taking 2–5 years; clinical endpoints (not a single E2 draw) are what carry the assessment.
Anti‑androgen co‑medication. Spironolactone (in the U.S.) and cyproterone acetate (where available, not US‑marketed) are the two main agents in routine use. Bicalutamide is an off‑label androgen‑receptor blocker used by some clinicians but carries a small but documented risk of liver injury (including rare fulminant hepatitis per LiverTox) and is generally framed as “other approaches” rather than first‑line.C2 GnRH analogs (leuprolide, triptorelin) provide potent gonadotropin suppression and are typically used when other strategies are inadequate, but are commonly limited by cost, insurance/access, and injection/implant logistics — not by efficacy. Estrogen monotherapy (no co‑med anti‑androgen) can achieve gonadotropin–testosterone suppression by negative feedback on the HPG axis, particularly with injectable routes that reach steady‑state E2 levels above ~200 pg/mL; an injectable‑estradiol cohort (PMC11649620 / JCEM 2025) reported >80% testosterone <50 ng/dL among weekly injectors not on GnRHa, but monotherapy was only a minority (~23%) of patients without gonadectomy and median monotherapy E2 was ~250 pg/mL. Oral monotherapy by contrast is not reliably suppressive (Leinung 2018: oral E2 alone “not infrequently unable” to suppress T).C2 A 2025 RCT (Angus et al., JCEM, PMID 39288020) found no breast-growth difference between spironolactone and cyproterone acetate at 6 months despite stronger testosterone suppression with CPA — weakening the case that more T-suppression maps directly to more feminization.C2
Recent (2024-2025) trans-cohort data add three substantive updates to the older HRT literature this section relies on. (a) Slack et al. 2024 (PMID 39233010) reports a 2,126-patient transfeminine retrospective cohort with VTE history 0.8% and estrogen use not independently associated with VTE after adjustment for age/comorbidity — the cis-postmenopausal ESTHER 4× transfer to trans HRT may overstate the absolute risk in younger, healthier trans cohorts. (b) Stangl, Wiepjes et al. 2025 (PMID 40377124) is the first prospective GAHT binding-protein time-course: oral E2 + CPA raises SHBG +81% at 12 months; oral E2 + GnRHa raises SHBG +242%; transdermal raises SHBG only with GnRHa — concrete GAHT-specific numbers (rather than borrowed cis-postmenopausal anchors). (c) Misakian et al. 2025 (PMID 39797602) 562-patient multicenter injectable cohort found median in-target weekly dose was 4 mg E2-equivalent; IM vs SC and EV vs EC differences were not statistically significant — the §10 injectable dose table's q5d vs q14d distinctions matter less than the literature historically implied.C2
EE is contraindicated in modern trans HRT (Endocrine Society 2017, WPATH SOC8). CEE (Premarin) is similarly out of favor for the same hepatic‑disproportion reason.
Route selection in patients with VTE risk factors (factor V Leiden, prior DVT, smoking, obesity, age >45–50) commonly defaults to transdermal or IM‑ester depot rather than oral, with WPATH SOC8 specifically flagging older age and elevated VTE risk as transdermal‑preferred indications.C1 The 4× OR contrast between oral and transdermal is the clinical reason this is the conservative default. Guidelines do not pin a hard BMI cutoff (BMI >30 is one common risk‑factor heuristic but is not a formal route‑selection threshold).
The pharmacology synthesized above collapses into a small number of trade‑offs that actually drive route choice. None of them is unique to trans HRT, but the relative weights are.
Reading the trade‑off in practice. Most decisions reduce to picking which of the three axes to optimize for and accepting non‑ideal performance on the other two:
What target serum E2 does and doesn't tell you. The 100–200 pg/mL window is a feedback‑loop monitoring target (will this dose suppress LH/FSH? Are we in the supraphysiologic range that raises VTE risk further?), not a feminization target.C2 Two patients with identical 150 pg/mL serum E2 can have very different breast development, mood, and body‑composition trajectories — depending on the time integral of free‑E2 over months (route- and adherence-dependent), androgen receptor signaling (residual testosterone level), and individual receptor / target‑tissue genetics. A single‑timepoint serum E2 is the cheapest‑to‑measure proxy for “the system has the substrate it needs,” not for “the patient is achieving their feminization goals.” The latter is set by clinical follow‑up, not laboratory chemistry.
What this synthesis can't tell you. The biggest gaps in the field are: (a) no head‑to‑head RCT comparing routes for trans HRT feminization endpoints (most data are observational or from cis postmenopausal HRT trials); (b) no validated free‑E2 assay in routine clinical use, so all monitoring is on total E2 with the free fraction inferred; (c) no longitudinal trans-population PK data of the granularity that would let the v4 model (or any model) be calibrated against a real trans HRT cohort instead of borrowed cis-postmenopausal anchors; and (d) the patient‑experience endpoints (mood, energy, body composition, dysphoria) are not measured in the studies that report serum E2 levels, so the inferential chain “serum E2 → feminization” is more model than data.C2
The C1–C5 inline claim tags throughout this page each link to the specific entry in evidence.html that supports (or doesn't support) the claim. (The tier badges in the legend table below are unlinked reference labels, not claims; hover any of them to see the tier definition.) A non‑exhaustive map of the load‑bearing claims by tier:
| Tier | Examples of claims |
|---|---|
| C1 | Enzyme directionalities (HSD17B1/2, SULT1E1, UGT regiospecificity, STS reactivation); ESTHER OR 4.2 vs 0.9; oral F ~5%; EE F ~45%; Back & Rogers 1982 gut/hepatic extraction; SHBG‑Kd for E2 ~20 nM (Avvakumov 2010); Kalme 1999 HepG2 dose‑response; EE 17β‑OH retained; E2MATE covalent FGly modification; SULT1E1 Km ~5–20 nM; oral EE single‑dose vs steady‑state Cmax; EE hepatic extraction 25%; sublingual Tmax 1–2 h; protein S falls in pregnancy. |
| C2 | Sublingual hepatic exposure (Cirrincione + indirect SHBG/protein markers); E2 mass balance against Kuhl 2005 textbook fractions; SULT1E1 lowest Km “for estrogens” (universal claim weaker); ESTHER finding generalizes by direction across cohorts; pregnancy SHBG buffering of ~÷1.7; cascade qualitative structure; EC508 architecture; sublingual absolute F (older textbooks vs marmoset vs Doll AUC ratio). |
| C3 | E2 mass balance percentages (model calibration, not radiolabel); v4 SHBG EC50 of 1150 pg/mL (calibration target); intracellular [E1]/[E2] of ~11 (thermodynamic with fragile inputs); gut‑wall E2 conjugation fraction of ~30–50% (no human portal‑vein E2 measurement); ÷30 SHBG induction saturation factor (modeled). |
| C4 | Bar 2024 protein S finding (ECE conference abstract, preliminary). |
| C5 | Exact split of EE gut‑wall conjugates among sulfate / 3‑glucuronide / 17‑glucuronide; EC508 human PK (no trials). |
The C1–C5 system is intentionally generous — every numerical or mechanistic claim above carries a tag. The pattern: basic enzyme biochemistry and population‑level PK numbers are stable C1; model‑calibrated quantities and inferred mechanisms degrade to C2–C3; preliminary clinical signals and unmeasured chemistry are C4–C5.
The same provenance discipline applies to the figures. Every plot on this page carries a corner badge stating what kind of object it is, so a reader never has to guess whether a curve is data or inference: Measured = points plotted directly from a cited primary or literature source; Modeled = a curve computed from a model (Hill saturation, free‑fraction equation, the v4 PK model) whose shape follows from assumptions, not measured points; Schematic = an illustrative structure or mechanism diagram carrying no quantitative claim. Hover any badge for the specifics of that figure. (The badge labels are an editorial provenance taxonomy, not a primary-source datum.)C3
Listed compactly; full discussion in evidence.html §11.